|
Download Data (XLS File) |
|
||||||||
|
||||||||
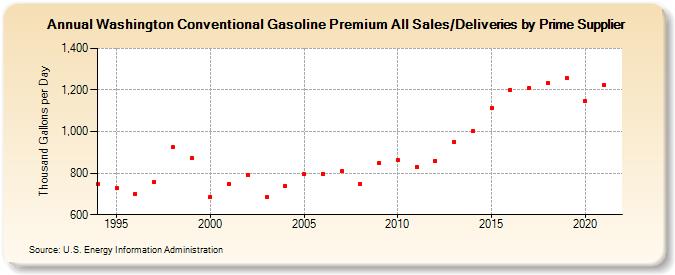
| Washington Conventional Gasoline Premium All Sales/Deliveries by Prime Supplier (Thousand Gallons per Day) | ||||||||
| Decade | Year-0 | Year-1 | Year-2 | Year-3 | Year-4 | Year-5 | Year-6 | Year-7 | Year-8 | Year-9 |
|---|---|---|---|---|---|---|---|---|---|---|
| 1990's | 747.9 | 728.9 | 700.1 | 759.3 | 923.5 | 871.8 | ||||
| 2000's | 685.9 | 749.4 | 789.7 | 683.9 | 739.1 | 794.6 | 797.3 | 808.0 | 746.6 | 849.3 |
| 2010's | 865.4 | 831.8 | 859.7 | 952.1 | 1,001.8 | 1,114.3 | 1,201.6 | 1,209.9 | 1,235.7 | 1,259.1 |
| 2020's | 1,145.2 |
| - = No Data Reported; -- = Not Applicable; NA = Not Available; W = Withheld to avoid disclosure of individual company data. |
| Release Date: 6/1/2022 |
| Next Release Date: TBD |