|
Download Data (XLS File) |
|
||||||||
|
||||||||
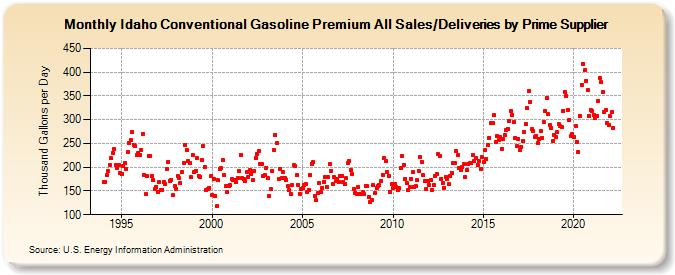
| Idaho Conventional Gasoline Premium All Sales/Deliveries by Prime Supplier (Thousand Gallons per Day) | ||||||||
| Year | Jan | Feb | Mar | Apr | May | Jun | Jul | Aug | Sep | Oct | Nov | Dec |
|---|---|---|---|---|---|---|---|---|---|---|---|---|
| 1993 | NA | NA | NA | |||||||||
| 1994 | 168.8 | 169.8 | 182.8 | 191.2 | 205.4 | 219.1 | 230.7 | 238.5 | 204.2 | 198.0 | 203.6 | 188.4 |
| 1995 | 186.4 | 201.5 | 208.9 | 197.1 | 233.0 | 251.0 | 257.0 | 273.5 | 245.7 | 243.8 | 225.3 | 230.3 |
| 1996 | 225.7 | 236.4 | 270.6 | 183.2 | 143.0 | 180.6 | 224.2 | 223.7 | 182.0 | 172.5 | 153.1 | 159.3 |
| 1997 | 148.0 | 168.9 | 151.3 | 153.0 | 167.8 | 164.2 | 196.7 | 211.5 | 171.8 | 173.8 | 140.5 | 160.8 |
| 1998 | 154.9 | 182.4 | 176.9 | 167.2 | 190.4 | 208.7 | 246.6 | 236.3 | 213.3 | 209.3 | 178.6 | 225.6 |
| 1999 | 190.0 | 192.4 | 219.5 | 181.5 | 179.6 | 215.3 | 244.0 | 201.3 | 151.7 | 153.7 | 155.7 | 181.4 |
| 2000 | 141.8 | 174.6 | 140.3 | 117.9 | 172.3 | 196.1 | 197.8 | 214.2 | 183.5 | 160.0 | 147.5 | 160.9 |
| 2001 | 161.8 | 175.7 | 172.3 | 173.0 | 168.4 | 177.7 | 192.2 | 226.4 | 176.4 | 175.0 | 171.0 | 189.8 |
| 2002 | 179.9 | 193.9 | 186.7 | 172.5 | 192.5 | 220.3 | 228.5 | 233.5 | 206.0 | 206.6 | 181.2 | 183.4 |
| 2003 | 199.2 | 176.7 | 139.7 | 153.3 | 192.9 | 236.8 | 268.7 | 251.0 | 174.5 | 197.1 | 177.0 | 189.0 |
| 2004 | 177.0 | 173.9 | 159.6 | 152.0 | 144.5 | 162.0 | 204.0 | 201.5 | 183.0 | 163.3 | 143.6 | 153.6 |
| 2005 | 155.4 | 163.2 | 163.7 | 148.7 | 152.5 | 184.0 | 207.4 | 210.8 | 139.2 | 130.0 | 144.9 | 167.6 |
| 2006 | 148.8 | 156.3 | 169.8 | 180.0 | 158.7 | 178.8 | 207.5 | 193.0 | 165.6 | 179.2 | 170.3 | 176.2 |
| 2007 | 169.1 | 180.9 | 182.1 | 169.0 | 164.4 | 176.7 | 207.9 | 212.9 | 194.8 | 185.1 | 154.1 | 146.3 |
| 2008 | 143.8 | 158.1 | 144.2 | 144.1 | 147.3 | 142.9 | 160.7 | 159.7 | 137.5 | 126.7 | 130.8 | 161.9 |
| 2009 | 146.3 | 156.6 | 161.1 | 161.7 | 171.4 | 184.2 | 218.5 | 212.5 | 190.7 | 182.5 | 148.6 | 164.0 |
| 2010 | 156.6 | 165.1 | 157.8 | 151.4 | 155.4 | 198.0 | 224.3 | 205.6 | 176.0 | 166.3 | 151.3 | 157.9 |
| 2011 | 175.7 | 189.8 | 158.4 | 159.7 | 172.4 | 192.8 | 221.9 | 211.7 | 182.9 | 170.1 | 154.1 | 171.6 |
| 2012 | 163.1 | 173.2 | 152.8 | 162.0 | 180.9 | 184.9 | 226.9 | 222.8 | 175.8 | 167.0 | 157.0 | 178.9 |
| 2013 | 174.8 | 165.3 | 181.1 | 188.7 | 208.7 | 208.4 | 233.9 | 224.7 | 198.2 | 194.6 | 199.6 | 206.9 |
| 2014 | 179.2 | 194.2 | 207.5 | 208.8 | 208.5 | 225.7 | 213.2 | 218.7 | 204.4 | 212.4 | 195.7 | 220.6 |
| 2015 | 210.0 | 235.9 | 217.1 | 247.3 | 262.2 | 293.3 | 292.6 | 309.2 | 253.5 | 265.6 | 256.7 | 263.9 |
| 2016 | 239.1 | 258.5 | 266.8 | 278.2 | 280.5 | 297.9 | 318.4 | 310.6 | 295.1 | 262.0 | 244.3 | 259.9 |
| 2017 | 235.9 | 243.1 | 256.0 | 273.5 | 290.5 | 323.8 | 360.5 | 337.6 | 280.1 | 276.3 | 264.4 | 266.5 |
| 2018 | 251.2 | 258.7 | 275.6 | 262.0 | 295.5 | 318.3 | 345.5 | 311.9 | 288.5 | 282.7 | 256.0 | 268.5 |
| 2019 | 263.7 | 273.1 | 290.0 | 285.7 | 283.6 | 319.3 | 358.4 | 349.3 | 321.0 | 300.0 | 266.0 | 269.2 |
| 2020 | 263.8 | 287.3 | 253.0 | 232.3 | 307.5 | 373.7 | 418.0 | 403.5 | 382.3 | 361.7 | 308.4 | 320.3 |
| 2021 | 318.7 | 310.2 | 304.2 | 308.6 | 338.8 | 387.8 | 378.6 | 358.7 | 317.0 | 319.8 | 293.5 | 289.5 |
| 2022 | 307.8 | 316.1 | 282.4 | |||||||||
| - = No Data Reported; -- = Not Applicable; NA = Not Available; W = Withheld to avoid disclosure of individual company data. |
| Release Date: 5/19/2022 |
| Next Release Date: TBD |