|
Download Data (XLS File) |
|
||||||||
|
||||||||
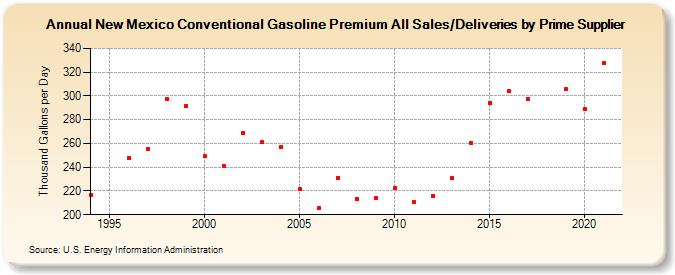
| New Mexico Conventional Gasoline Premium All Sales/Deliveries by Prime Supplier (Thousand Gallons per Day) | ||||||||
| Decade | Year-0 | Year-1 | Year-2 | Year-3 | Year-4 | Year-5 | Year-6 | Year-7 | Year-8 | Year-9 |
|---|---|---|---|---|---|---|---|---|---|---|
| 1990's | 216.6 | W | 247.8 | 255.1 | 297.4 | 291.4 | ||||
| 2000's | 249.1 | 241.1 | 269.0 | 261.0 | 257.1 | 221.4 | 205.4 | 230.9 | 213.1 | 213.7 |
| 2010's | 222.2 | 210.3 | 215.8 | 231.0 | 260.4 | 294.1 | 303.8 | 297.0 | W | 305.5 |
| 2020's | 288.9 |
| - = No Data Reported; -- = Not Applicable; NA = Not Available; W = Withheld to avoid disclosure of individual company data. |
| Release Date: 6/1/2022 |
| Next Release Date: TBD |