|
Download Data (XLS File) |
|
||||||||
|
||||||||
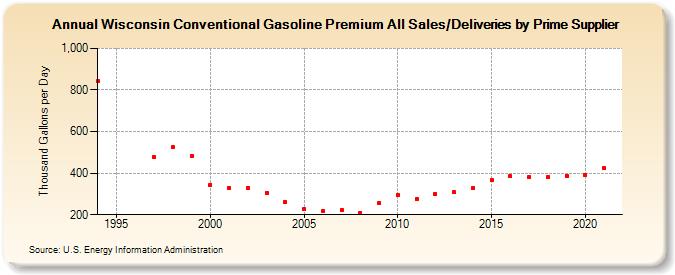
| Wisconsin Conventional Gasoline Premium All Sales/Deliveries by Prime Supplier (Thousand Gallons per Day) | ||||||||
| Decade | Year-0 | Year-1 | Year-2 | Year-3 | Year-4 | Year-5 | Year-6 | Year-7 | Year-8 | Year-9 |
|---|---|---|---|---|---|---|---|---|---|---|
| 1990's | 841.0 | W | W | 477.0 | 525.3 | 482.5 | ||||
| 2000's | 345.1 | 330.2 | 329.1 | 306.5 | 260.8 | 225.6 | 218.4 | 222.9 | 209.9 | 257.0 |
| 2010's | 295.0 | 276.5 | 300.3 | 307.1 | 328.1 | 365.1 | 386.2 | 379.5 | 381.5 | 387.6 |
| 2020's | 391.7 |
| - = No Data Reported; -- = Not Applicable; NA = Not Available; W = Withheld to avoid disclosure of individual company data. |
| Release Date: 6/1/2022 |
| Next Release Date: TBD |