|
Download Data (XLS File) |
|
||||||||
|
||||||||
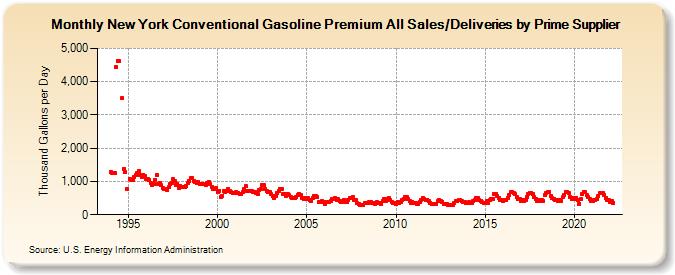
| New York Conventional Gasoline Premium All Sales/Deliveries by Prime Supplier (Thousand Gallons per Day) | ||||||||
| Year | Jan | Feb | Mar | Apr | May | Jun | Jul | Aug | Sep | Oct | Nov | Dec |
|---|---|---|---|---|---|---|---|---|---|---|---|---|
| 1993 | NA | NA | NA | |||||||||
| 1994 | 1,282.1 | 1,263.2 | 1,245.6 | 1,267.3 | 4,444.5 | 4,622.3 | 4,611.6 | W | 3,501.0 | 1,389.1 | 1,276.6 | 769.8 |
| 1995 | W | 1,067.9 | 1,044.6 | 1,047.9 | 1,142.4 | 1,181.0 | 1,261.3 | 1,320.6 | 1,184.0 | 1,145.8 | 1,201.5 | 1,157.6 |
| 1996 | 1,083.1 | 1,077.9 | 1,044.1 | 960.5 | 893.0 | 923.5 | 1,054.5 | 1,199.6 | 922.8 | 941.4 | 881.3 | 794.3 |
| 1997 | 767.3 | 770.2 | 753.8 | 828.8 | 920.6 | 967.4 | 1,072.2 | 1,010.6 | 899.9 | 936.0 | 803.5 | 857.7 |
| 1998 | 825.6 | 835.2 | 842.3 | 862.3 | 965.6 | 1,025.1 | 1,108.5 | 1,102.3 | 1,018.8 | 980.2 | 950.5 | 985.3 |
| 1999 | 928.4 | 929.9 | 923.9 | W | 879.1 | 955.5 | 987.1 | 930.6 | 847.9 | 784.1 | 768.4 | 807.2 |
| 2000 | 672.6 | 727.6 | 530.6 | 570.4 | 716.6 | 697.7 | 715.7 | 779.0 | 705.3 | 688.5 | 646.9 | 667.4 |
| 2001 | 673.3 | 646.6 | 655.1 | 618.9 | 623.5 | 688.9 | 765.7 | 853.5 | 712.8 | 717.4 | 707.1 | 716.8 |
| 2002 | 679.9 | 695.1 | 660.1 | 626.5 | 743.7 | 773.0 | 882.6 | 892.6 | 761.5 | 722.2 | 677.9 | 677.9 |
| 2003 | 610.4 | 556.9 | 505.6 | 568.0 | 666.9 | 710.9 | 785.7 | 773.4 | 609.2 | 631.4 | 577.2 | 626.0 |
| 2004 | 583.1 | 534.2 | 492.9 | 503.0 | 491.0 | 546.9 | 598.9 | 626.5 | 578.7 | 509.3 | 471.1 | 506.7 |
| 2005 | 468.8 | 492.6 | 442.3 | 411.5 | 504.8 | 561.9 | 560.7 | 526.1 | 379.9 | 373.9 | 406.9 | 382.5 |
| 2006 | 322.8 | 371.0 | 388.8 | 373.1 | 407.4 | 468.6 | 486.1 | 502.6 | 449.9 | 458.0 | 417.2 | 393.7 |
| 2007 | 397.6 | 447.5 | 381.1 | 397.0 | 447.0 | 490.3 | 495.3 | 537.3 | 447.3 | 453.6 | 343.7 | 336.5 |
| 2008 | 291.0 | 297.5 | 281.5 | 346.1 | 358.2 | 348.1 | 382.3 | 396.2 | 354.1 | 341.2 | 321.6 | 380.0 |
| 2009 | 353.0 | 360.2 | 324.0 | 402.4 | 466.0 | 415.7 | 475.4 | 516.2 | 447.9 | 388.4 | 344.5 | 339.9 |
| 2010 | 330.5 | 370.0 | 355.1 | 378.8 | 449.2 | 464.8 | 519.7 | 518.3 | 462.5 | 417.3 | 364.6 | 378.3 |
| 2011 | 341.5 | 361.9 | 322.7 | 319.5 | 389.4 | 436.8 | 498.8 | 477.7 | 428.0 | 456.4 | 404.7 | 364.6 |
| 2012 | 327.6 | 330.4 | 329.7 | 336.4 | 415.3 | 448.2 | 398.2 | 391.7 | 336.4 | 324.8 | 333.2 | 297.0 |
| 2013 | 302.5 | 289.1 | 284.9 | 358.2 | 412.6 | 420.0 | 431.0 | 457.1 | 402.5 | 382.6 | 367.7 | 352.4 |
| 2014 | 353.8 | 371.0 | 356.6 | 354.5 | 416.0 | 455.7 | 514.2 | 499.2 | 438.3 | 422.2 | 373.3 | 361.0 |
| 2015 | 364.1 | 411.9 | 366.2 | 429.3 | 472.3 | 485.1 | 636.6 | 628.8 | 555.6 | 495.3 | 446.6 | 435.9 |
| 2016 | 416.2 | 444.1 | 445.3 | 514.4 | 601.5 | 671.9 | 692.9 | 663.9 | 610.0 | 519.8 | 479.1 | 458.9 |
| 2017 | 401.2 | 431.1 | 426.8 | 447.2 | 526.8 | 617.7 | 662.0 | 655.5 | 617.6 | 525.6 | 477.6 | 427.2 |
| 2018 | 432.2 | 419.6 | 441.6 | 417.9 | 583.9 | 649.1 | 685.5 | 693.1 | 568.4 | 496.6 | 465.1 | 432.8 |
| 2019 | 432.9 | 413.3 | 428.2 | 424.2 | 518.2 | 595.6 | 688.2 | 696.4 | 638.7 | 542.5 | 464.7 | 504.5 |
| 2020 | 474.4 | 513.7 | 430.7 | 330.8 | 463.3 | 617.0 | 675.4 | 673.9 | 589.3 | 522.7 | 467.7 | 426.4 |
| 2021 | 417.6 | 446.4 | 430.8 | 474.9 | 563.2 | 642.5 | 651.2 | 667.6 | 599.7 | 499.1 | 444.8 | 428.5 |
| 2022 | 395.7 | 415.8 | 350.4 | |||||||||
| - = No Data Reported; -- = Not Applicable; NA = Not Available; W = Withheld to avoid disclosure of individual company data. |
| Release Date: 5/19/2022 |
| Next Release Date: TBD |