|
Download Data (XLS File) |
|
||||||||
|
||||||||
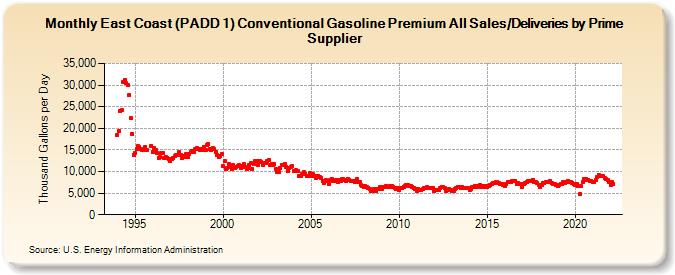
| East Coast (PADD 1) Conventional Gasoline Premium All Sales/Deliveries by Prime Supplier (Thousand Gallons per Day) | ||||||||
| Year | Jan | Feb | Mar | Apr | May | Jun | Jul | Aug | Sep | Oct | Nov | Dec |
|---|---|---|---|---|---|---|---|---|---|---|---|---|
| 1993 | NA | NA | NA | |||||||||
| 1994 | 18,499.5 | 19,377.9 | 23,986.2 | 24,246.1 | 30,599.3 | 31,279.7 | 30,371.7 | 30,115.5 | 27,617.4 | 22,301.9 | 18,787.8 | 13,932.3 |
| 1995 | 14,232.2 | 15,113.1 | 15,888.9 | 15,693.9 | 15,266.6 | 15,009.9 | 14,930.5 | 15,733.7 | 15,028.1 | W | W | 16,017.2 |
| 1996 | 14,591.1 | 15,420.1 | 14,925.0 | 14,258.0 | 13,136.9 | 13,283.4 | 14,200.0 | 14,245.9 | 13,215.4 | 13,423.6 | 13,235.7 | 12,858.8 |
| 1997 | 12,378.0 | 13,000.1 | 13,170.1 | 13,473.5 | 13,737.9 | 13,726.3 | 14,533.5 | 13,835.9 | 13,089.5 | 13,532.6 | 13,418.5 | 13,968.2 |
| 1998 | 13,309.9 | 14,128.1 | 14,603.3 | 14,795.0 | 14,532.8 | 15,108.8 | 15,344.6 | 15,201.5 | 14,883.7 | 15,120.1 | 14,991.8 | 15,629.0 |
| 1999 | 14,889.1 | 16,211.0 | 16,329.3 | 15,210.8 | 14,935.8 | 15,359.0 | 15,170.9 | 14,574.5 | 13,787.9 | 13,335.1 | 13,588.7 | 14,048.4 |
| 2000 | 11,269.6 | 12,362.4 | 10,590.2 | 10,805.5 | 11,662.6 | 11,145.0 | 10,688.1 | 11,489.4 | 10,725.5 | 11,104.7 | 11,217.9 | 11,473.5 |
| 2001 | 10,855.9 | 11,237.2 | 11,655.9 | 11,136.8 | 10,585.0 | 10,725.0 | 11,425.0 | 11,960.2 | 10,627.5 | 11,834.2 | 12,396.8 | 12,334.4 |
| 2002 | 11,496.6 | 12,540.8 | 12,163.3 | 11,514.6 | 12,031.1 | 11,911.3 | 12,376.7 | 12,646.8 | 11,617.3 | 11,659.5 | 11,557.5 | 11,656.0 |
| 2003 | 10,643.8 | 9,911.2 | 9,885.8 | 10,757.4 | 11,519.0 | 11,455.4 | 11,699.3 | 11,143.2 | 10,217.8 | 10,917.6 | 11,033.7 | 11,304.6 |
| 2004 | 10,028.0 | 10,170.5 | 10,249.8 | 10,145.9 | 8,976.2 | 8,939.9 | 9,440.3 | 9,771.3 | 9,506.6 | 8,873.5 | 8,957.3 | 9,547.8 |
| 2005 | 8,996.0 | 9,398.8 | 9,048.0 | 8,382.3 | 8,964.9 | 8,980.8 | 8,719.5 | 8,445.1 | 7,707.0 | 7,372.4 | 7,984.4 | 7,899.0 |
| 2006 | 7,145.8 | 7,978.4 | 8,325.1 | 7,714.6 | 7,798.9 | 7,954.6 | 7,611.3 | 8,044.6 | 7,857.8 | 8,166.9 | 8,157.0 | 7,942.1 |
| 2007 | 7,884.1 | 8,342.8 | 8,141.8 | 7,765.2 | 7,814.2 | 7,759.9 | 7,679.8 | 8,298.9 | 7,661.4 | 7,633.7 | 6,826.5 | 6,715.9 |
| 2008 | 6,415.4 | 6,592.8 | 6,350.6 | 6,251.5 | 5,978.1 | 5,592.0 | 5,588.3 | 5,838.0 | 5,449.1 | 5,930.2 | 5,894.4 | 6,305.0 |
| 2009 | 5,915.4 | 6,315.2 | 6,467.4 | 6,679.4 | 6,512.0 | 6,496.5 | 6,673.9 | 6,610.5 | 6,383.0 | 6,280.0 | 5,955.7 | 6,084.5 |
| 2010 | 5,728.4 | 6,105.0 | 6,267.8 | 6,522.6 | 6,610.7 | 6,779.3 | 6,858.2 | 6,691.9 | 6,648.7 | 6,434.8 | 6,286.4 | 6,029.5 |
| 2011 | 5,408.8 | 5,934.4 | 5,810.3 | 5,749.0 | 5,860.9 | 6,198.1 | 6,132.7 | 6,315.5 | 6,108.9 | 6,147.1 | 6,219.7 | 6,221.4 |
| 2012 | 5,413.9 | 5,777.0 | 5,761.3 | 5,727.6 | 6,145.6 | 6,314.0 | 6,333.9 | 6,093.9 | 5,505.9 | 5,827.8 | 5,945.5 | 5,802.1 |
| 2013 | 5,583.8 | 5,587.5 | 5,849.4 | 6,196.5 | 6,438.7 | 6,333.3 | 6,210.4 | 6,457.3 | 6,193.3 | 6,263.5 | 6,205.2 | 6,135.1 |
| 2014 | 5,807.0 | 6,052.9 | 6,327.5 | 6,326.8 | 6,558.7 | 6,511.2 | 6,649.0 | 6,784.9 | 6,389.7 | 6,625.8 | 6,440.4 | 6,572.0 |
| 2015 | 6,385.7 | 6,639.8 | 6,854.9 | 7,219.9 | 7,229.4 | 7,230.1 | 7,512.3 | 7,488.6 | 7,263.5 | 7,146.3 | 7,125.7 | 6,978.2 |
| 2016 | 6,679.1 | 7,168.5 | 7,581.4 | 7,496.1 | 7,685.8 | 7,799.5 | 7,785.5 | 7,765.3 | 7,188.9 | 7,445.5 | 7,166.2 | 7,002.8 |
| 2017 | 6,493.3 | 6,996.3 | 7,358.6 | 7,501.9 | 7,873.9 | 7,891.3 | 7,903.5 | 8,102.6 | 7,494.4 | 7,474.6 | 7,321.0 | 6,942.5 |
| 2018 | 6,503.8 | 6,862.1 | 7,429.2 | 7,400.5 | 7,624.7 | 7,575.2 | 7,580.9 | 7,711.6 | 7,287.8 | 7,220.3 | 7,121.6 | 6,861.0 |
| 2019 | 6,702.8 | 6,792.4 | 7,100.9 | 7,161.2 | 7,488.1 | 7,390.1 | 7,491.9 | 7,827.3 | 7,458.3 | 7,470.2 | 7,312.9 | 7,219.2 |
| 2020 | 6,858.0 | 7,112.4 | 6,639.8 | 4,754.9 | 6,533.8 | 7,594.9 | 8,323.6 | 8,265.1 | 8,148.1 | 8,141.3 | 7,853.9 | 7,747.3 |
| 2021 | 7,465.7 | 7,599.1 | 8,134.3 | 8,685.4 | 9,160.5 | 8,984.8 | 8,914.7 | 8,870.8 | 8,494.6 | 8,216.9 | 7,983.6 | 7,673.1 |
| 2022 | 6,953.5 | 7,498.0 | 7,223.0 | |||||||||
| - = No Data Reported; -- = Not Applicable; NA = Not Available; W = Withheld to avoid disclosure of individual company data. |
| Release Date: 5/19/2022 |
| Next Release Date: TBD |