|
Download Data (XLS File) |
|
||||||||
|
||||||||
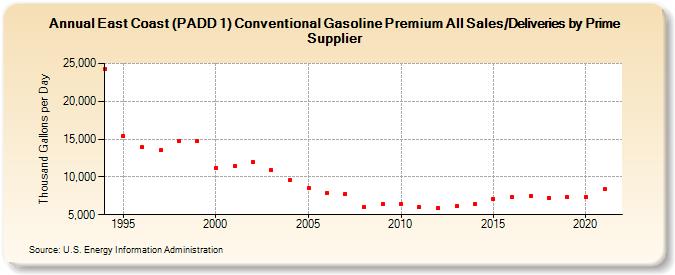
| East Coast (PADD 1) Conventional Gasoline Premium All Sales/Deliveries by Prime Supplier (Thousand Gallons per Day) | ||||||||
| Decade | Year-0 | Year-1 | Year-2 | Year-3 | Year-4 | Year-5 | Year-6 | Year-7 | Year-8 | Year-9 |
|---|---|---|---|---|---|---|---|---|---|---|
| 1990's | 24,286.3 | 15,374.0 | 13,896.9 | 13,493.4 | 14,808.1 | 14,778.3 | ||||
| 2000's | 11,207.5 | 11,401.1 | 11,929.0 | 10,882.1 | 9,549.0 | 8,486.6 | 7,890.4 | 7,707.4 | 6,014.7 | 6,364.7 |
| 2010's | 6,414.6 | 6,008.9 | 5,888.1 | 6,124.3 | 6,423.6 | 7,092.2 | 7,398.1 | 7,448.7 | 7,267.3 | 7,288.2 |
| 2020's | 7,334.9 |
| - = No Data Reported; -- = Not Applicable; NA = Not Available; W = Withheld to avoid disclosure of individual company data. |
| Release Date: 6/1/2022 |
| Next Release Date: TBD |