|
Download Data (XLS File) |
|
||||||||
|
||||||||
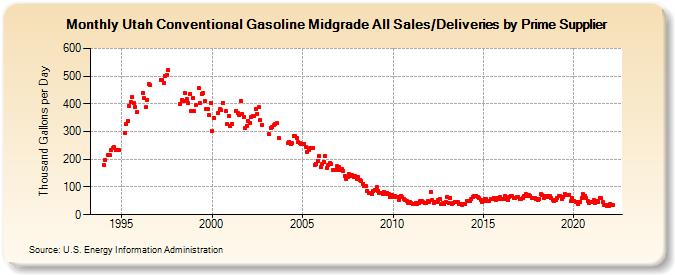
| Utah Conventional Gasoline Midgrade All Sales/Deliveries by Prime Supplier (Thousand Gallons per Day) | ||||||||
| Year | Jan | Feb | Mar | Apr | May | Jun | Jul | Aug | Sep | Oct | Nov | Dec |
|---|---|---|---|---|---|---|---|---|---|---|---|---|
| 1993 | NA | NA | NA | |||||||||
| 1994 | 178.5 | 198.9 | W | 213.8 | 213.8 | 234.2 | 239.9 | 243.6 | 233.6 | W | 232.3 | W |
| 1995 | W | W | 293.7 | 325.8 | 338.2 | 393.3 | 406.9 | 424.0 | 403.0 | 387.3 | 370.9 | W |
| 1996 | W | W | 440.3 | 420.6 | 387.5 | 415.2 | 471.5 | 467.3 | W | W | W | W |
| 1997 | W | W | 486.3 | 485.1 | 475.2 | 502.2 | 504.1 | 520.4 | W | W | W | W |
| 1998 | W | W | W | 400.7 | 415.2 | 411.7 | 437.3 | 418.5 | 404.7 | 434.5 | 372.8 | 422.0 |
| 1999 | 373.0 | 394.0 | W | 455.8 | 403.4 | 436.6 | 439.7 | 410.6 | 379.6 | 380.3 | 359.9 | 403.5 |
| 2000 | 301.8 | 350.3 | W | W | 367.8 | 380.1 | 377.6 | 404.8 | W | 374.2 | 326.2 | 357.4 |
| 2001 | 318.6 | 328.9 | W | W | 375.8 | 365.7 | 359.5 | 411.9 | 363.5 | 354.1 | 311.3 | 321.1 |
| 2002 | 337.4 | 332.3 | 352.7 | 354.8 | 357.8 | 380.0 | 364.6 | 387.2 | 341.4 | 325.3 | W | W |
| 2003 | W | W | 289.5 | 314.3 | 316.9 | 322.3 | 326.9 | 329.8 | 278.0 | W | W | W |
| 2004 | W | W | 258.3 | 263.6 | 256.8 | 257.2 | 282.2 | 283.1 | 278.3 | 261.3 | 259.1 | 254.1 |
| 2005 | 253.3 | 255.4 | 245.0 | 227.9 | 234.7 | 241.9 | 239.5 | 239.8 | 180.0 | 184.0 | 193.4 | 212.6 |
| 2006 | 171.4 | 181.6 | 191.6 | 213.2 | 168.9 | 179.0 | 185.4 | 181.2 | 163.0 | 163.0 | 160.1 | 175.2 |
| 2007 | 170.4 | 161.8 | 163.5 | 158.3 | 140.1 | 128.9 | 136.5 | 146.2 | 141.4 | 143.3 | 136.6 | 138.8 |
| 2008 | 129.6 | 134.9 | 126.2 | 122.5 | 112.3 | 105.1 | 103.0 | 86.9 | 78.2 | 78.3 | 73.1 | 84.0 |
| 2009 | 89.0 | 98.9 | 86.0 | 78.4 | 76.8 | 75.7 | 81.9 | 76.1 | 76.7 | 75.3 | 65.6 | 70.0 |
| 2010 | 62.8 | 66.3 | 62.5 | 62.1 | 52.3 | 68.4 | 62.7 | 57.8 | 51.5 | 48.5 | 43.7 | 44.8 |
| 2011 | 41.9 | 40.0 | 40.4 | 41.3 | 39.7 | 43.8 | 47.8 | 49.3 | 44.8 | 42.5 | 42.7 | 47.9 |
| 2012 | 44.5 | 81.7 | 51.6 | 43.4 | 44.8 | 45.0 | 51.5 | 58.4 | 40.1 | 40.8 | 38.4 | 45.9 |
| 2013 | 64.0 | 40.5 | 60.6 | 40.0 | 41.8 | 46.2 | 47.1 | 44.4 | 39.6 | 38.9 | 36.6 | 38.8 |
| 2014 | 39.3 | 49.0 | 49.1 | 50.6 | 55.9 | 65.4 | 68.0 | 66.8 | 63.9 | 60.9 | 54.1 | 47.5 |
| 2015 | 48.0 | 54.9 | 55.6 | 49.7 | 47.7 | 55.9 | 57.3 | 58.5 | 54.4 | 60.2 | 56.1 | 62.3 |
| 2016 | 56.5 | 56.2 | 67.2 | 57.9 | 53.4 | 65.7 | 69.2 | 66.2 | 61.8 | 59.4 | 62.8 | 62.4 |
| 2017 | 57.5 | 57.5 | 61.2 | 66.6 | 75.4 | 67.2 | 72.1 | 68.7 | 61.6 | 59.2 | 60.6 | 57.0 |
| 2018 | 53.1 | 56.2 | 73.6 | 70.0 | 60.3 | 66.1 | 67.1 | 63.0 | 66.7 | 59.7 | 54.1 | 50.7 |
| 2019 | 54.1 | 61.5 | 67.3 | 68.3 | 57.3 | 63.0 | 75.5 | 69.6 | 69.4 | 72.5 | 48.3 | 61.0 |
| 2020 | 50.1 | 46.5 | 46.4 | 38.7 | 47.6 | 60.2 | 73.1 | 68.1 | 59.3 | 49.1 | 42.5 | 46.4 |
| 2021 | 44.1 | 53.4 | 43.8 | 48.9 | 47.2 | 59.8 | 58.9 | 46.4 | 34.3 | 36.2 | 30.5 | 31.2 |
| 2022 | 40.0 | 35.7 | 33.7 | |||||||||
| - = No Data Reported; -- = Not Applicable; NA = Not Available; W = Withheld to avoid disclosure of individual company data. |
| Release Date: 5/19/2022 |
| Next Release Date: TBD |