|
Download Data (XLS File) |
|
||||||||
|
||||||||
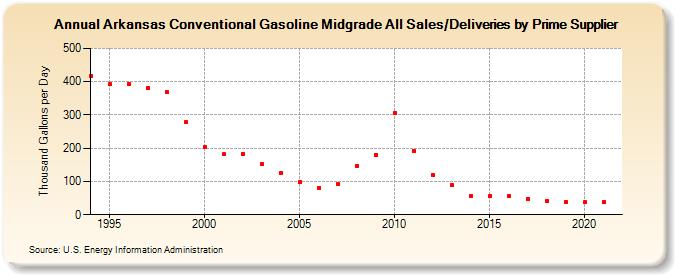
| Arkansas Conventional Gasoline Midgrade All Sales/Deliveries by Prime Supplier (Thousand Gallons per Day) | ||||||||
| Decade | Year-0 | Year-1 | Year-2 | Year-3 | Year-4 | Year-5 | Year-6 | Year-7 | Year-8 | Year-9 |
|---|---|---|---|---|---|---|---|---|---|---|
| 1990's | 416.5 | 391.7 | 394.4 | 381.3 | 367.9 | 277.3 | ||||
| 2000's | 202.1 | 181.1 | 183.2 | 153.1 | 125.3 | 97.8 | 81.1 | 92.6 | 146.2 | 179.5 |
| 2010's | 306.6 | 191.5 | 120.8 | 90.0 | 55.6 | 56.4 | 55.7 | 46.8 | 40.3 | 39.0 |
| 2020's | 36.9 |
| - = No Data Reported; -- = Not Applicable; NA = Not Available; W = Withheld to avoid disclosure of individual company data. |
| Release Date: 6/1/2022 |
| Next Release Date: TBD |