|
Download Data (XLS File) |
|
||||||||
|
||||||||
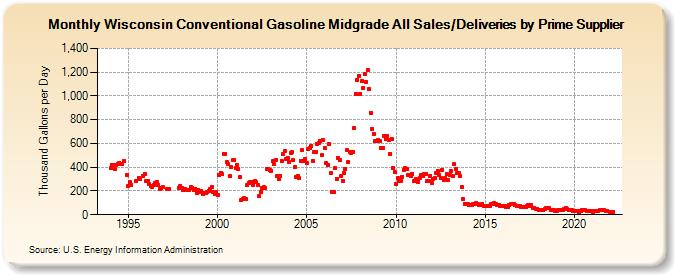
| Wisconsin Conventional Gasoline Midgrade All Sales/Deliveries by Prime Supplier (Thousand Gallons per Day) | ||||||||
| Year | Jan | Feb | Mar | Apr | May | Jun | Jul | Aug | Sep | Oct | Nov | Dec |
|---|---|---|---|---|---|---|---|---|---|---|---|---|
| 1993 | NA | NA | NA | |||||||||
| 1994 | 391.5 | 420.6 | 421.9 | 381.4 | 421.8 | 423.4 | 438.8 | 424.8 | 427.8 | 453.0 | W | 338.1 |
| 1995 | 244.0 | 273.7 | 253.0 | W | W | 283.8 | W | 308.0 | 301.0 | W | 326.2 | 344.2 |
| 1996 | 283.2 | 286.9 | 260.2 | 238.5 | 237.3 | 253.1 | 270.4 | 278.3 | 250.1 | 220.2 | 222.1 | 229.2 |
| 1997 | W | W | 219.1 | 214.0 | W | W | W | W | W | W | 227.7 | 245.7 |
| 1998 | 226.5 | 207.1 | 213.4 | 205.4 | 207.2 | 211.4 | 232.0 | 226.5 | 208.0 | 219.1 | 186.1 | 208.2 |
| 1999 | 188.3 | 198.7 | 171.2 | 179.4 | 181.3 | 192.5 | 203.4 | 214.7 | 235.5 | 188.4 | 176.2 | 189.5 |
| 2000 | 168.2 | 335.8 | 350.7 | 344.2 | 512.0 | 513.7 | 442.0 | 422.8 | 323.6 | 399.7 | 458.3 | 457.1 |
| 2001 | 389.9 | 422.2 | 387.9 | 316.9 | 125.6 | 130.2 | 136.8 | 134.0 | 249.2 | 267.3 | 276.8 | 277.5 |
| 2002 | 252.6 | 280.5 | 273.4 | 253.7 | 155.6 | 193.1 | 223.0 | 229.8 | 226.0 | 388.1 | 387.3 | 377.8 |
| 2003 | 369.7 | 448.7 | 424.1 | 457.1 | 328.0 | 302.9 | 327.2 | 453.6 | 514.7 | 532.5 | 466.5 | 480.0 |
| 2004 | 446.5 | 522.4 | 524.2 | 459.0 | 397.5 | 321.2 | 328.3 | 308.3 | 453.3 | 542.0 | 455.8 | 466.0 |
| 2005 | 436.3 | 554.2 | 562.0 | 579.6 | 456.1 | 531.7 | 530.5 | 593.8 | 604.8 | 616.8 | 501.7 | 625.5 |
| 2006 | 563.1 | 433.1 | 421.4 | 593.7 | 349.5 | 195.3 | 188.3 | 390.6 | 304.7 | 480.5 | 458.0 | 325.7 |
| 2007 | 286.1 | 349.2 | 388.1 | 546.6 | 441.6 | 528.5 | 521.9 | 529.3 | 728.8 | 1,019.6 | 1,137.3 | 1,171.3 |
| 2008 | 1,018.3 | 1,122.6 | 1,066.3 | 1,184.0 | 1,117.1 | 1,214.9 | 1,057.5 | 859.5 | 725.1 | 681.5 | 619.8 | 617.4 |
| 2009 | 629.4 | 622.7 | 565.5 | 563.5 | 660.7 | 636.8 | 664.6 | 630.9 | 513.6 | 639.0 | 395.9 | 360.8 |
| 2010 | 256.7 | 307.1 | 280.4 | 285.0 | 321.6 | 380.3 | 393.5 | 387.9 | 336.0 | 330.8 | 329.9 | 346.2 |
| 2011 | 282.1 | 303.0 | 281.2 | 278.1 | 310.2 | 333.8 | 323.6 | 343.2 | 341.6 | 282.8 | 281.9 | 328.8 |
| 2012 | 270.2 | 303.2 | 310.4 | 354.5 | 370.1 | 335.3 | 305.2 | 378.8 | 291.5 | 310.1 | 344.9 | 289.2 |
| 2013 | 333.6 | 366.4 | 324.6 | 424.0 | 384.1 | 352.1 | 352.1 | 327.8 | 233.7 | 128.2 | 91.5 | 88.7 |
| 2014 | 91.9 | 85.5 | 79.9 | 79.3 | 91.0 | 87.1 | 101.8 | 90.6 | 82.8 | 82.4 | 86.0 | 75.7 |
| 2015 | 76.3 | 74.4 | 71.0 | 76.3 | 86.4 | 92.1 | 102.6 | 93.0 | 84.3 | 82.6 | 76.8 | 70.7 |
| 2016 | 75.4 | 71.7 | 65.0 | 68.5 | 82.0 | 87.5 | 90.3 | 87.7 | 80.2 | 76.5 | 73.9 | 77.1 |
| 2017 | 68.6 | 68.8 | 67.4 | 68.1 | 77.1 | 80.2 | 76.0 | 79.0 | 58.5 | 55.7 | 50.1 | 46.7 |
| 2018 | 43.2 | 41.2 | 39.1 | 38.8 | 47.7 | 57.7 | 55.6 | 54.0 | 41.3 | 40.2 | 36.9 | 35.4 |
| 2019 | 35.3 | 37.8 | 36.1 | 35.8 | 39.6 | 45.6 | 53.9 | 49.7 | 37.7 | 37.5 | 36.8 | 33.9 |
| 2020 | 31.3 | 32.3 | 27.9 | 19.9 | 32.4 | 37.1 | 42.4 | 40.7 | 33.7 | 31.6 | 27.6 | 27.1 |
| 2021 | 26.0 | 33.8 | 29.5 | 30.4 | 32.7 | 39.6 | 42.6 | 38.4 | 35.5 | 31.0 | 31.0 | W |
| 2022 | 22.9 | 25.9 | 23.4 | |||||||||
| - = No Data Reported; -- = Not Applicable; NA = Not Available; W = Withheld to avoid disclosure of individual company data. |
| Release Date: 5/19/2022 |
| Next Release Date: TBD |