|
Download Data (XLS File) |
|
||||||||
|
||||||||
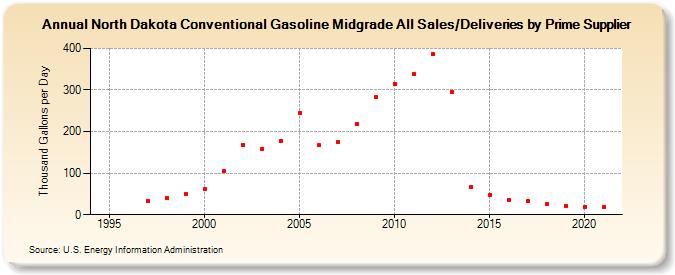
| North Dakota Conventional Gasoline Midgrade All Sales/Deliveries by Prime Supplier (Thousand Gallons per Day) | ||||||||
| Decade | Year-0 | Year-1 | Year-2 | Year-3 | Year-4 | Year-5 | Year-6 | Year-7 | Year-8 | Year-9 |
|---|---|---|---|---|---|---|---|---|---|---|
| 1990's | W | W | W | 32.5 | 41.0 | 49.4 | ||||
| 2000's | 62.2 | 104.1 | 168.3 | 158.6 | 178.4 | 245.1 | 166.8 | 175.2 | 218.4 | 282.3 |
| 2010's | 315.1 | 337.9 | 386.7 | 295.7 | 67.7 | 48.1 | 35.6 | 33.3 | 24.8 | 21.9 |
| 2020's | 18.6 |
| - = No Data Reported; -- = Not Applicable; NA = Not Available; W = Withheld to avoid disclosure of individual company data. |
| Release Date: 6/1/2022 |
| Next Release Date: TBD |