|
Download Data (XLS File) |
|
||||||||
|
||||||||
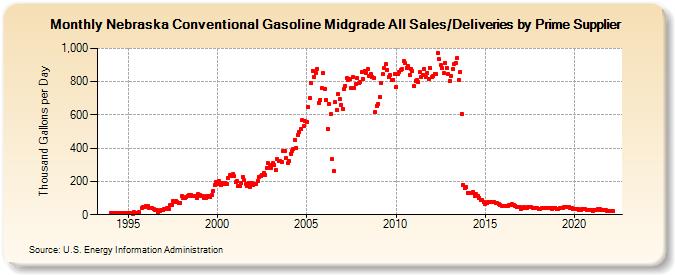
| Nebraska Conventional Gasoline Midgrade All Sales/Deliveries by Prime Supplier (Thousand Gallons per Day) | ||||||||
| Year | Jan | Feb | Mar | Apr | May | Jun | Jul | Aug | Sep | Oct | Nov | Dec |
|---|---|---|---|---|---|---|---|---|---|---|---|---|
| 1993 | NA | NA | NA | |||||||||
| 1994 | 9.4 | 9.1 | 8.3 | 8.4 | 9.1 | 9.1 | 9.4 | 10.3 | 9.7 | 10.5 | 10.8 | 10.6 |
| 1995 | 8.8 | 9.9 | 12.9 | 6.5 | 13.4 | 11.6 | 10.5 | 15.0 | W | 41.2 | 45.6 | 44.7 |
| 1996 | 51.7 | 50.2 | 42.4 | 40.0 | 39.5 | 34.6 | 30.3 | 29.0 | 19.2 | 23.5 | 26.5 | 30.1 |
| 1997 | 34.2 | 35.6 | 37.4 | 36.7 | 56.0 | 60.1 | 84.5 | 76.1 | 81.2 | 76.0 | 69.2 | 73.1 |
| 1998 | 110.7 | 98.1 | 103.4 | 108.4 | 112.4 | 121.3 | 118.7 | 111.7 | 113.7 | 114.3 | 102.3 | 122.0 |
| 1999 | 119.5 | 111.1 | 114.5 | 101.9 | 99.8 | 111.7 | 110.8 | 107.6 | 117.5 | 144.5 | 179.8 | 199.6 |
| 2000 | 183.4 | 202.8 | 181.5 | 188.8 | 185.0 | 188.3 | 183.8 | 223.7 | 237.2 | 233.7 | 243.0 | 234.8 |
| 2001 | 194.6 | 200.0 | 175.0 | 172.0 | 189.5 | 228.8 | 206.0 | 184.2 | 170.7 | 189.3 | 167.1 | 190.1 |
| 2002 | 176.8 | 186.8 | 184.6 | 205.1 | 225.5 | 231.1 | 240.9 | 252.7 | 240.8 | 281.5 | 310.9 | 300.3 |
| 2003 | 283.1 | 309.0 | 298.4 | 268.5 | 335.4 | 322.3 | 321.1 | 315.6 | 385.2 | 380.1 | 341.9 | 309.1 |
| 2004 | 321.1 | 366.2 | 383.5 | 394.9 | 449.2 | 403.5 | 481.8 | 497.9 | 518.1 | 568.5 | 533.1 | 560.8 |
| 2005 | 558.8 | 648.9 | 702.1 | 793.0 | 866.6 | 826.9 | 854.3 | 878.0 | 673.4 | 692.5 | 761.3 | 849.3 |
| 2006 | 757.5 | 692.2 | 518.1 | 666.5 | 602.6 | 332.7 | 260.0 | 675.6 | 630.5 | 728.1 | 695.7 | 661.9 |
| 2007 | 638.2 | 753.3 | 775.5 | 820.4 | 808.7 | 814.7 | 760.9 | 827.2 | 762.0 | 782.9 | 820.3 | 789.6 |
| 2008 | 797.7 | 855.5 | 815.2 | 864.9 | 854.3 | 873.7 | 831.1 | 844.7 | 830.2 | 821.9 | 616.5 | 653.9 |
| 2009 | 666.1 | 710.7 | 789.6 | 843.1 | 880.4 | 903.5 | 870.4 | 827.7 | 839.8 | 807.0 | 812.9 | 846.6 |
| 2010 | 767.5 | 845.6 | 856.5 | 871.9 | 874.4 | 922.8 | 910.5 | 883.4 | 892.8 | 841.7 | 878.8 | 861.7 |
| 2011 | 771.0 | 806.8 | 808.1 | 798.1 | 855.8 | 830.9 | 839.3 | 876.7 | 826.6 | 854.9 | 813.0 | 881.1 |
| 2012 | 827.0 | 831.5 | 847.4 | 845.7 | 974.6 | 934.5 | 898.3 | 879.5 | 849.1 | 912.2 | 884.8 | 845.8 |
| 2013 | 806.7 | 835.0 | 873.7 | 904.4 | 913.7 | 943.5 | 812.8 | 860.4 | 607.7 | 180.6 | 160.4 | 164.5 |
| 2014 | 130.8 | 132.4 | 130.0 | 130.1 | 137.2 | 113.8 | 122.4 | 112.7 | 103.0 | 86.7 | 88.2 | 79.0 |
| 2015 | 63.9 | 72.3 | 74.1 | 76.4 | 74.4 | 78.0 | 77.6 | 73.3 | 68.2 | 62.0 | 60.2 | 52.5 |
| 2016 | 50.0 | 50.8 | 51.6 | 53.6 | 56.6 | 57.4 | 61.8 | 56.3 | 54.7 | 43.5 | 47.7 | 46.8 |
| 2017 | 35.9 | 40.5 | 45.3 | 41.4 | 42.0 | 45.1 | 43.6 | 43.6 | 43.1 | 43.1 | 41.2 | 41.2 |
| 2018 | 36.3 | 35.9 | 39.5 | 38.7 | 37.8 | 41.9 | 41.8 | 41.4 | 37.9 | 35.7 | 41.0 | 42.1 |
| 2019 | 34.3 | 36.3 | 39.6 | 39.3 | 39.5 | 44.3 | 48.6 | 47.8 | 44.5 | 41.6 | 41.6 | 37.1 |
| 2020 | 32.2 | 34.6 | 32.3 | 27.3 | 30.6 | 33.2 | 35.2 | 32.6 | 30.0 | 29.6 | 30.5 | 28.3 |
| 2021 | 23.9 | 26.5 | 28.5 | 30.7 | 36.1 | 33.7 | 29.4 | 28.2 | 30.4 | 25.8 | 24.6 | 25.1 |
| 2022 | 20.0 | 20.4 | 20.6 | |||||||||
| - = No Data Reported; -- = Not Applicable; NA = Not Available; W = Withheld to avoid disclosure of individual company data. |
| Release Date: 5/19/2022 |
| Next Release Date: TBD |