|
Download Data (XLS File) |
|
||||||||
|
||||||||
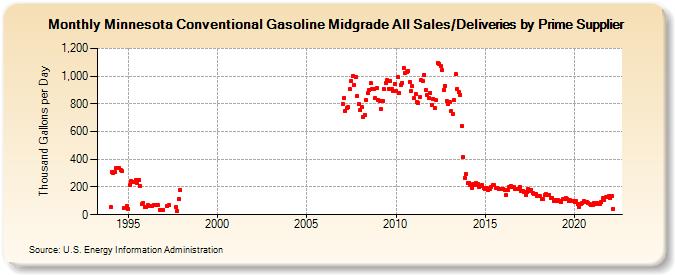
| Minnesota Conventional Gasoline Midgrade All Sales/Deliveries by Prime Supplier (Thousand Gallons per Day) | ||||||||
| Year | Jan | Feb | Mar | Apr | May | Jun | Jul | Aug | Sep | Oct | Nov | Dec |
|---|---|---|---|---|---|---|---|---|---|---|---|---|
| 1993 | NA | NA | NA | |||||||||
| 1994 | 53.4 | 309.3 | 302.3 | 308.9 | 337.6 | W | 338.1 | 325.1 | 312.3 | 51.3 | W | 61.3 |
| 1995 | 41.7 | 211.7 | 241.0 | 237.1 | 238.8 | 249.0 | 232.2 | 253.1 | 206.3 | 79.0 | 87.3 | 56.5 |
| 1996 | 55.1 | 68.4 | 64.2 | 63.1 | 64.6 | 68.8 | W | 67.5 | 67.7 | 36.1 | 36.6 | 36.6 |
| 1997 | W | W | 60.2 | 67.2 | W | W | W | W | 53.2 | 30.3 | 115.3 | 176.7 |
| 1998 | - | - | - | - | - | - | - | - | - | - | - | - |
| 1999 | - | - | - | - | - | - | - | - | - | - | - | - |
| 2000 | - | - | - | - | - | - | - | - | - | - | - | - |
| 2001 | - | - | - | - | - | - | - | - | - | - | - | - |
| 2002 | - | - | - | - | - | - | - | - | - | - | - | - |
| 2003 | - | - | - | - | - | - | - | - | - | - | - | - |
| 2004 | - | - | - | - | - | - | - | - | - | - | - | - |
| 2005 | - | - | - | - | - | - | - | - | - | - | - | - |
| 2006 | - | - | - | - | - | - | - | - | - | - | - | - |
| 2007 | 799.1 | 843.8 | 747.2 | 771.5 | 774.6 | 906.7 | 963.3 | 1,003.0 | 936.0 | 993.5 | 855.3 | 799.3 |
| 2008 | 752.7 | 779.4 | 705.3 | 717.4 | 827.5 | 876.2 | 898.9 | 946.9 | 907.5 | 910.1 | 839.3 | 914.7 |
| 2009 | 829.1 | 817.7 | 760.8 | 821.7 | 904.4 | 951.8 | 974.8 | 910.1 | 965.8 | 907.5 | 895.8 | 945.5 |
| 2010 | 895.0 | 993.3 | 877.5 | 934.5 | 953.1 | 1,061.8 | 1,022.5 | 1,028.1 | 1,034.6 | 956.5 | 893.4 | 930.1 |
| 2011 | 839.4 | 870.0 | 814.6 | 807.1 | 847.3 | 970.6 | 961.7 | 1,007.9 | 901.8 | 862.5 | 844.9 | 880.3 |
| 2012 | 789.7 | 836.9 | 768.4 | 827.1 | 1,098.0 | 1,089.3 | 1,070.9 | 1,041.1 | 898.7 | 928.1 | 817.0 | 801.2 |
| 2013 | 811.7 | 748.2 | 727.5 | 828.7 | 1,011.8 | 907.2 | 885.9 | 864.3 | 640.6 | 412.8 | 265.1 | 293.0 |
| 2014 | 225.3 | 229.3 | 215.7 | 194.4 | 223.8 | 212.3 | 226.0 | 221.2 | 203.5 | 204.4 | 213.0 | 196.3 |
| 2015 | 186.6 | 189.6 | 175.5 | 188.3 | 202.3 | 215.0 | 213.4 | 195.3 | 195.1 | 186.4 | 186.7 | 182.5 |
| 2016 | 187.6 | 179.2 | 142.2 | 178.8 | 200.9 | 209.6 | 200.1 | 202.9 | 186.7 | 184.6 | 183.8 | 201.5 |
| 2017 | 170.6 | 170.7 | 163.2 | 142.7 | 161.1 | 183.8 | 170.3 | 179.4 | 153.2 | 150.6 | 147.9 | 135.3 |
| 2018 | 132.3 | 132.2 | 111.6 | 112.0 | 139.5 | 147.9 | 143.4 | 144.9 | 123.4 | 123.0 | 102.0 | 103.2 |
| 2019 | 100.3 | 104.7 | 99.5 | 92.4 | 112.1 | 112.6 | 121.2 | 116.3 | 99.5 | 103.8 | 100.8 | 98.6 |
| 2020 | 93.2 | 96.9 | 74.5 | 57.6 | 79.1 | 87.7 | 97.5 | 92.3 | 90.5 | 85.8 | 75.2 | 71.9 |
| 2021 | 72.7 | 86.8 | 79.4 | 85.6 | 79.5 | 78.7 | 89.5 | 118.1 | 102.6 | 125.1 | 124.3 | 134.4 |
| 2022 | 122.3 | 131.6 | 42.5 | |||||||||
| - = No Data Reported; -- = Not Applicable; NA = Not Available; W = Withheld to avoid disclosure of individual company data. |
| Release Date: 5/19/2022 |
| Next Release Date: TBD |