|
Download Data (XLS File) |
|
||||||||
|
||||||||
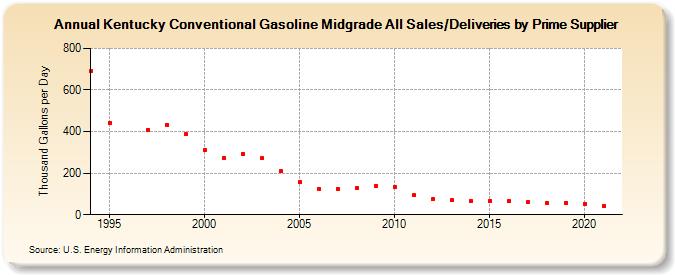
| Kentucky Conventional Gasoline Midgrade All Sales/Deliveries by Prime Supplier (Thousand Gallons per Day) | ||||||||
| Decade | Year-0 | Year-1 | Year-2 | Year-3 | Year-4 | Year-5 | Year-6 | Year-7 | Year-8 | Year-9 |
|---|---|---|---|---|---|---|---|---|---|---|
| 1990's | 692.8 | 442.9 | W | 408.3 | 432.8 | 386.5 | ||||
| 2000's | 309.6 | 275.0 | 294.2 | 271.4 | 208.8 | 158.1 | 124.1 | 124.5 | 129.0 | 139.9 |
| 2010's | 135.4 | 93.6 | 74.1 | 68.7 | 66.0 | 67.4 | 63.8 | 61.2 | 57.5 | 58.6 |
| 2020's | 52.6 |
| - = No Data Reported; -- = Not Applicable; NA = Not Available; W = Withheld to avoid disclosure of individual company data. |
| Release Date: 6/1/2022 |
| Next Release Date: TBD |