|
Download Data (XLS File) |
|
||||||||
|
||||||||
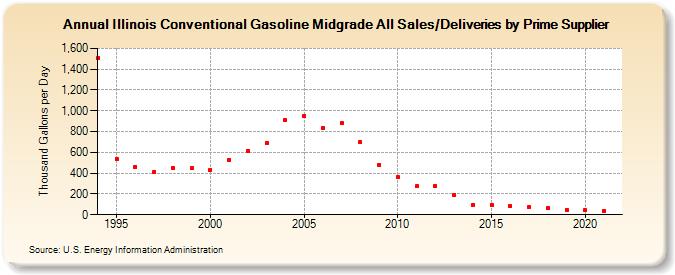
| Illinois Conventional Gasoline Midgrade All Sales/Deliveries by Prime Supplier (Thousand Gallons per Day) | ||||||||
| Decade | Year-0 | Year-1 | Year-2 | Year-3 | Year-4 | Year-5 | Year-6 | Year-7 | Year-8 | Year-9 |
|---|---|---|---|---|---|---|---|---|---|---|
| 1990's | 1,509.0 | 539.8 | 461.4 | 410.6 | 450.7 | 445.5 | ||||
| 2000's | 431.5 | 528.2 | 614.8 | 691.0 | 907.6 | 949.1 | 835.2 | 882.2 | 695.0 | 481.9 |
| 2010's | 362.5 | 271.7 | 275.3 | 189.6 | 95.5 | 97.4 | 84.5 | 72.7 | 64.5 | 49.3 |
| 2020's | 42.3 |
| - = No Data Reported; -- = Not Applicable; NA = Not Available; W = Withheld to avoid disclosure of individual company data. |
| Release Date: 6/1/2022 |
| Next Release Date: TBD |