|
Download Data (XLS File) |
|
||||||||
|
||||||||
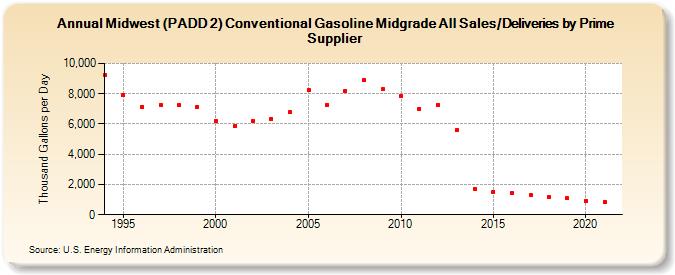
| Midwest (PADD 2) Conventional Gasoline Midgrade All Sales/Deliveries by Prime Supplier (Thousand Gallons per Day) | ||||||||
| Decade | Year-0 | Year-1 | Year-2 | Year-3 | Year-4 | Year-5 | Year-6 | Year-7 | Year-8 | Year-9 |
|---|---|---|---|---|---|---|---|---|---|---|
| 1990's | 9,206.3 | 7,890.7 | 7,141.6 | 7,263.5 | 7,266.5 | 7,153.9 | ||||
| 2000's | 6,213.9 | 5,842.4 | 6,180.6 | 6,337.1 | 6,776.6 | 8,246.5 | 7,280.3 | 8,213.1 | 8,891.4 | 8,288.2 |
| 2010's | 7,856.7 | 7,018.6 | 7,283.1 | 5,592.9 | 1,703.7 | 1,527.3 | 1,444.4 | 1,318.8 | 1,165.0 | 1,084.0 |
| 2020's | 939.7 |
| - = No Data Reported; -- = Not Applicable; NA = Not Available; W = Withheld to avoid disclosure of individual company data. |
| Release Date: 6/1/2022 |
| Next Release Date: TBD |