|
Download Data (XLS File) |
|
||||||||
|
||||||||
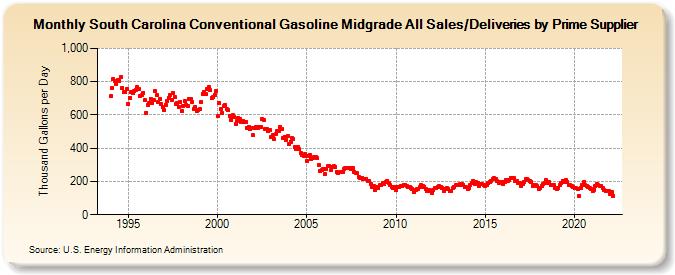
| South Carolina Conventional Gasoline Midgrade All Sales/Deliveries by Prime Supplier (Thousand Gallons per Day) | ||||||||
| Year | Jan | Feb | Mar | Apr | May | Jun | Jul | Aug | Sep | Oct | Nov | Dec |
|---|---|---|---|---|---|---|---|---|---|---|---|---|
| 1993 | NA | NA | NA | |||||||||
| 1994 | 711.6 | 760.9 | 816.5 | 804.5 | 784.1 | 812.1 | 805.7 | 826.4 | 762.3 | 736.2 | 738.6 | 756.8 |
| 1995 | 668.3 | 703.5 | 735.8 | 728.8 | 744.8 | 752.3 | 767.8 | 756.6 | 716.0 | 717.7 | 734.0 | 687.3 |
| 1996 | 613.2 | 659.4 | 669.1 | 698.2 | 671.8 | 687.7 | 743.3 | 716.8 | 677.5 | 694.3 | 664.4 | 648.5 |
| 1997 | 628.0 | 661.3 | 686.2 | 703.9 | 719.0 | 690.1 | 732.2 | 709.7 | 664.5 | 671.0 | 648.9 | 678.1 |
| 1998 | 623.3 | 654.6 | 681.1 | 660.8 | 651.9 | 695.7 | 695.1 | 678.7 | 635.6 | 649.6 | 621.5 | 631.8 |
| 1999 | 632.6 | 677.4 | 726.5 | 740.5 | 724.6 | 754.8 | 769.2 | 747.5 | 703.3 | 707.8 | 717.8 | 744.1 |
| 2000 | 592.0 | 673.8 | 634.1 | 612.4 | 653.5 | 659.9 | 635.6 | 629.4 | 593.3 | 571.5 | 596.9 | 589.2 |
| 2001 | 544.7 | 562.8 | 583.5 | 578.2 | 559.3 | 561.2 | 555.2 | 560.4 | 518.7 | 528.5 | 518.2 | 518.6 |
| 2002 | 476.5 | 520.6 | 528.4 | 524.1 | 529.1 | 529.6 | 575.1 | 570.9 | 513.5 | 513.4 | 501.4 | 511.6 |
| 2003 | 469.2 | 478.0 | 454.8 | 483.7 | 501.7 | 501.3 | 526.0 | 513.8 | 460.9 | 468.4 | 451.1 | 474.6 |
| 2004 | 423.0 | 439.8 | 461.1 | 453.6 | 407.1 | 395.6 | 405.5 | 392.6 | 368.6 | 359.9 | 354.8 | 363.5 |
| 2005 | 325.2 | 353.8 | 359.7 | 334.6 | 342.9 | 346.4 | 344.9 | 338.7 | 300.2 | 260.6 | 268.0 | 273.9 |
| 2006 | 242.0 | 274.5 | 290.1 | 291.3 | 267.8 | 288.6 | 291.0 | 287.3 | 258.7 | 252.6 | 256.4 | 257.5 |
| 2007 | 256.7 | 274.6 | 282.8 | 278.6 | 277.9 | 281.8 | 274.3 | 279.3 | 255.5 | 249.5 | 248.4 | 229.3 |
| 2008 | 222.4 | 222.9 | 214.0 | 213.2 | 214.1 | 200.7 | 202.1 | 186.3 | 169.3 | 172.8 | 150.1 | 166.2 |
| 2009 | 158.1 | 176.7 | 178.6 | 193.5 | 186.2 | 198.6 | 204.9 | 191.1 | 176.6 | 168.6 | 161.2 | 164.5 |
| 2010 | 146.8 | 164.3 | 166.7 | 174.7 | 172.0 | 179.1 | 181.6 | 173.3 | 163.8 | 165.6 | 158.7 | 154.8 |
| 2011 | 135.4 | 151.4 | 153.3 | 155.4 | 164.9 | 176.0 | 171.6 | 168.3 | 152.3 | 143.1 | 148.8 | 144.3 |
| 2012 | 130.7 | 146.4 | 158.1 | 161.5 | 165.7 | 169.7 | 167.2 | 162.5 | 144.9 | 152.6 | 160.1 | 156.0 |
| 2013 | 139.9 | 145.3 | 158.0 | 167.0 | 176.5 | 177.5 | 177.6 | 181.9 | 184.0 | 180.1 | 166.8 | 164.4 |
| 2014 | 155.3 | 158.8 | 178.0 | 188.9 | 204.7 | 186.3 | 194.5 | 192.3 | 175.4 | 187.3 | 182.1 | 176.5 |
| 2015 | 175.1 | 177.4 | 190.6 | 199.2 | 205.1 | 215.9 | 218.1 | 211.9 | 200.0 | 189.2 | 197.1 | 193.7 |
| 2016 | 184.2 | 194.5 | 207.2 | 205.7 | 211.6 | 221.0 | 223.4 | 219.9 | 200.5 | 200.2 | 192.2 | 188.5 |
| 2017 | 175.0 | 186.8 | 195.6 | 214.1 | 215.1 | 207.9 | 201.8 | 198.5 | 175.5 | 177.2 | 178.3 | 170.3 |
| 2018 | 154.4 | 163.6 | 174.4 | 186.9 | 193.0 | 206.4 | 192.7 | 197.5 | 179.2 | 176.3 | 176.2 | 162.8 |
| 2019 | 155.9 | 163.6 | 178.0 | 189.3 | 205.0 | 196.8 | 207.6 | 199.4 | 179.9 | 179.8 | 170.5 | 165.2 |
| 2020 | 159.7 | 158.9 | 155.6 | 115.3 | 163.1 | 180.2 | 193.9 | 179.5 | 171.9 | 169.3 | 160.3 | 156.0 |
| 2021 | 143.6 | 150.6 | 170.4 | 187.2 | 176.4 | 173.7 | 173.3 | 158.1 | 148.8 | 145.2 | 141.0 | 139.8 |
| 2022 | 121.9 | 138.0 | 111.3 | |||||||||
| - = No Data Reported; -- = Not Applicable; NA = Not Available; W = Withheld to avoid disclosure of individual company data. |
| Release Date: 5/19/2022 |
| Next Release Date: TBD |