|
Download Data (XLS File) |
|
||||||||
|
||||||||
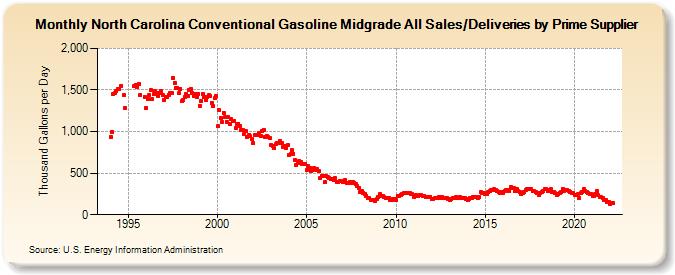
| North Carolina Conventional Gasoline Midgrade All Sales/Deliveries by Prime Supplier (Thousand Gallons per Day) | ||||||||
| Year | Jan | Feb | Mar | Apr | May | Jun | Jul | Aug | Sep | Oct | Nov | Dec |
|---|---|---|---|---|---|---|---|---|---|---|---|---|
| 1993 | NA | NA | NA | |||||||||
| 1994 | 935.9 | 994.6 | 1,452.2 | 1,465.9 | 1,486.6 | 1,513.2 | 1,508.3 | 1,552.3 | W | 1,435.8 | 1,287.7 | W |
| 1995 | W | W | W | W | 1,542.0 | 1,563.6 | 1,537.9 | 1,571.9 | 1,444.3 | W | W | 1,418.8 |
| 1996 | 1,288.7 | 1,388.5 | 1,437.0 | 1,494.0 | 1,389.5 | 1,446.1 | 1,486.0 | 1,467.3 | 1,425.2 | 1,468.3 | 1,486.9 | 1,433.8 |
| 1997 | 1,373.4 | 1,415.9 | 1,410.1 | 1,444.6 | 1,461.9 | 1,467.2 | 1,642.9 | 1,586.2 | 1,527.8 | 1,523.8 | 1,460.9 | 1,512.7 |
| 1998 | 1,366.7 | 1,383.9 | 1,416.2 | 1,450.5 | 1,429.7 | 1,505.3 | 1,515.1 | 1,464.1 | 1,422.0 | 1,453.9 | 1,416.7 | 1,451.7 |
| 1999 | 1,311.9 | 1,368.1 | 1,456.9 | 1,415.5 | 1,379.5 | 1,417.0 | 1,436.5 | 1,429.5 | 1,347.8 | 1,301.4 | 1,400.2 | 1,424.9 |
| 2000 | 1,062.6 | 1,255.5 | 1,162.0 | 1,116.8 | 1,226.4 | 1,169.4 | 1,119.4 | 1,171.9 | 1,094.6 | 1,147.8 | 1,132.6 | 1,125.4 |
| 2001 | 1,042.4 | 1,084.9 | 1,094.5 | 1,072.4 | 1,020.5 | 1,018.5 | 975.5 | 1,003.2 | 937.7 | 962.4 | 940.9 | 908.3 |
| 2002 | 860.7 | 959.6 | 957.7 | 954.0 | 983.0 | 947.0 | 1,004.6 | 1,022.9 | 936.7 | 951.8 | 933.6 | 917.9 |
| 2003 | 839.5 | 832.0 | 799.1 | 846.0 | 867.8 | 862.8 | 885.7 | 860.0 | 816.0 | 831.3 | 806.1 | 835.8 |
| 2004 | 718.2 | 724.4 | 775.7 | 734.3 | 657.8 | 602.5 | 620.4 | 644.8 | 632.1 | 613.9 | 609.3 | 607.3 |
| 2005 | 541.2 | 586.6 | 565.3 | 519.7 | 536.8 | 562.1 | 537.1 | 547.1 | 523.8 | 438.5 | 469.2 | 462.4 |
| 2006 | 389.8 | 464.6 | 449.7 | 441.2 | 429.3 | 426.9 | 421.8 | 436.4 | 397.1 | 392.8 | 406.2 | 405.1 |
| 2007 | 393.2 | 398.9 | 416.1 | 380.0 | 376.8 | 394.9 | 376.5 | 396.2 | 385.0 | 367.0 | 341.9 | 322.7 |
| 2008 | 278.2 | 280.1 | 264.5 | 250.5 | 230.7 | 200.9 | 197.5 | 182.9 | 180.6 | 174.2 | 160.8 | 188.1 |
| 2009 | 210.3 | 244.6 | 222.3 | 228.5 | 207.9 | 202.3 | 205.8 | 200.4 | 179.8 | 182.5 | 189.8 | 188.7 |
| 2010 | 176.0 | 223.1 | 226.4 | 234.1 | 249.0 | 256.7 | 260.6 | 257.7 | 255.5 | 260.7 | 252.1 | 245.2 |
| 2011 | 217.3 | 238.0 | 225.8 | 222.9 | 232.9 | 232.4 | 221.1 | 227.8 | 213.9 | 213.9 | 218.0 | 216.7 |
| 2012 | 185.2 | 194.0 | 202.4 | 202.2 | 206.2 | 211.0 | 206.5 | 211.7 | 198.9 | 203.9 | 204.3 | 193.2 |
| 2013 | 179.9 | 184.0 | 202.5 | 195.2 | 211.0 | 203.3 | 203.0 | 207.7 | 202.9 | 198.3 | 200.6 | 187.3 |
| 2014 | 172.4 | 184.2 | 195.2 | 203.3 | 216.7 | 208.4 | 209.8 | 200.5 | 209.1 | 272.5 | 264.4 | 266.3 |
| 2015 | 249.1 | 245.1 | 269.3 | 281.2 | 293.9 | 299.1 | 305.7 | 291.3 | 288.1 | 273.2 | 264.1 | 267.7 |
| 2016 | 263.6 | 282.4 | 294.5 | 302.2 | 289.5 | 334.5 | 320.1 | 325.3 | 284.8 | 305.1 | 281.0 | 268.8 |
| 2017 | 243.7 | 265.4 | 277.2 | 291.6 | 310.3 | 314.1 | 303.8 | 309.1 | 281.6 | 279.6 | 270.7 | 261.1 |
| 2018 | 234.0 | 256.4 | 269.5 | 285.6 | 305.8 | 304.9 | 289.1 | 298.6 | 303.5 | 272.3 | 268.9 | 257.4 |
| 2019 | 242.8 | 246.5 | 261.6 | 269.2 | 312.2 | 291.0 | 293.6 | 294.4 | 289.8 | 273.8 | 264.9 | 255.5 |
| 2020 | 242.6 | 241.3 | 244.6 | 200.0 | 255.5 | 274.1 | 304.0 | 285.5 | 273.5 | 259.3 | 245.9 | 246.6 |
| 2021 | 223.9 | 225.8 | 248.4 | 280.2 | 233.3 | 212.4 | 208.4 | 197.9 | 176.9 | 173.2 | 152.1 | 148.7 |
| 2022 | 132.4 | 140.9 | 138.7 | |||||||||
| - = No Data Reported; -- = Not Applicable; NA = Not Available; W = Withheld to avoid disclosure of individual company data. |
| Release Date: 5/19/2022 |
| Next Release Date: TBD |