|
Download Data (XLS File) |
|
||||||||
|
||||||||
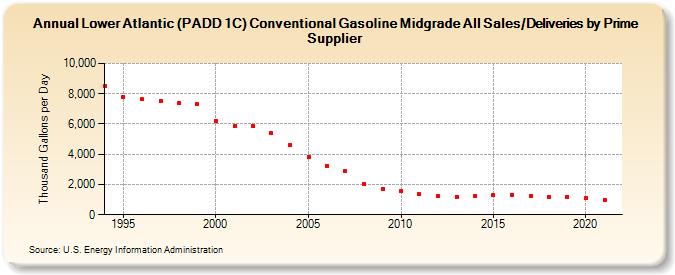
| Lower Atlantic (PADD 1C) Conventional Gasoline Midgrade All Sales/Deliveries by Prime Supplier (Thousand Gallons per Day) | ||||||||
| Decade | Year-0 | Year-1 | Year-2 | Year-3 | Year-4 | Year-5 | Year-6 | Year-7 | Year-8 | Year-9 |
|---|---|---|---|---|---|---|---|---|---|---|
| 1990's | 8,496.3 | 7,807.6 | 7,631.5 | 7,529.7 | 7,363.0 | 7,319.5 | ||||
| 2000's | 6,216.8 | 5,842.9 | 5,860.9 | 5,383.2 | 4,634.7 | 3,802.6 | 3,245.8 | 2,903.1 | 2,028.3 | 1,728.6 |
| 2010's | 1,581.4 | 1,348.8 | 1,224.6 | 1,194.0 | 1,206.1 | 1,286.9 | 1,304.5 | 1,259.1 | 1,193.9 | 1,185.5 |
| 2020's | 1,085.9 |
| - = No Data Reported; -- = Not Applicable; NA = Not Available; W = Withheld to avoid disclosure of individual company data. |
| Release Date: 6/1/2022 |
| Next Release Date: TBD |