|
Download Data (XLS File) |
|
||||||||
|
||||||||
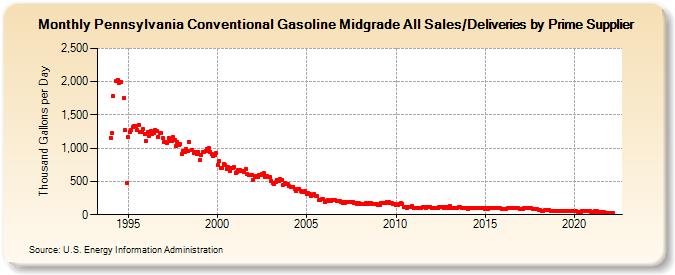
| Pennsylvania Conventional Gasoline Midgrade All Sales/Deliveries by Prime Supplier (Thousand Gallons per Day) | ||||||||
| Year | Jan | Feb | Mar | Apr | May | Jun | Jul | Aug | Sep | Oct | Nov | Dec |
|---|---|---|---|---|---|---|---|---|---|---|---|---|
| 1993 | NA | NA | NA | |||||||||
| 1994 | 1,154.0 | 1,231.4 | 1,780.1 | W | 2,012.9 | 2,026.2 | 1,985.0 | 2,000.3 | W | 1,749.5 | 1,266.5 | 475.8 |
| 1995 | 1,163.5 | 1,242.9 | 1,279.2 | 1,319.0 | 1,333.8 | 1,327.2 | 1,273.1 | 1,353.3 | 1,242.3 | 1,239.2 | 1,285.2 | 1,209.8 |
| 1996 | 1,102.6 | 1,241.4 | 1,188.0 | 1,251.9 | 1,215.6 | 1,231.7 | 1,275.6 | 1,265.3 | 1,172.1 | 1,228.0 | 1,223.2 | 1,147.4 |
| 1997 | 1,096.9 | 1,087.6 | 1,076.5 | 1,146.5 | 1,112.1 | 1,101.1 | 1,166.5 | 1,130.4 | 1,029.7 | 1,086.1 | 1,041.9 | 1,057.9 |
| 1998 | 910.6 | 955.7 | 938.5 | 981.4 | 953.5 | 1,091.6 | W | 968.1 | 934.2 | 945.1 | 912.4 | 945.1 |
| 1999 | 822.0 | 904.2 | 946.3 | 950.0 | 955.4 | 993.7 | 1,005.6 | 941.3 | 905.2 | 883.5 | 900.3 | 924.6 |
| 2000 | 740.3 | 808.8 | 698.5 | 696.8 | 762.8 | 754.5 | 688.3 | 716.3 | 662.0 | 699.2 | 705.1 | 718.8 |
| 2001 | 633.9 | 635.4 | 666.6 | 675.0 | 656.7 | 651.4 | 641.1 | 687.9 | 617.0 | 592.0 | 591.0 | 594.0 |
| 2002 | 528.0 | 563.9 | 577.7 | 568.3 | 599.9 | 598.5 | 612.3 | 619.5 | 562.6 | 585.0 | 565.7 | 568.7 |
| 2003 | 512.5 | 477.4 | 454.6 | 490.2 | 521.0 | 507.0 | 533.6 | 527.4 | 443.2 | 472.7 | 459.6 | 456.8 |
| 2004 | 429.6 | 414.6 | 409.7 | 421.5 | 382.4 | 359.0 | 387.2 | 383.1 | 363.2 | 334.1 | 340.2 | 352.6 |
| 2005 | 307.5 | 323.6 | 307.4 | 282.8 | 299.0 | 306.0 | 286.9 | 278.6 | 214.6 | 216.1 | 229.2 | 232.5 |
| 2006 | 189.8 | 211.2 | 217.5 | 208.8 | 206.8 | 220.7 | 228.6 | 221.0 | 205.3 | 201.5 | 200.7 | 194.9 |
| 2007 | 182.5 | 194.2 | 182.0 | 189.7 | 194.5 | 190.4 | 188.0 | 197.8 | 177.0 | 177.7 | 161.0 | 173.7 |
| 2008 | 159.0 | 157.8 | 168.2 | 165.3 | 169.1 | 168.4 | 172.9 | 181.5 | 162.0 | 168.5 | 162.6 | 167.0 |
| 2009 | 153.2 | 151.9 | 168.8 | 178.1 | 178.2 | 179.4 | 184.5 | 185.1 | 177.6 | 169.4 | 154.6 | 165.1 |
| 2010 | 145.5 | 150.6 | 159.9 | 174.6 | 162.1 | 122.7 | 116.0 | 108.1 | 111.7 | 120.3 | 122.0 | 123.6 |
| 2011 | 99.2 | 102.5 | 106.4 | 104.0 | 95.9 | 102.7 | 108.9 | 110.2 | 108.4 | 123.2 | 112.8 | 113.0 |
| 2012 | 98.3 | 102.4 | 105.3 | 104.5 | 105.4 | 113.1 | 117.5 | 118.2 | 102.2 | 112.0 | 111.1 | 100.6 |
| 2013 | 132.5 | 95.9 | 98.5 | 101.5 | 103.7 | 105.3 | 110.2 | 110.9 | 106.3 | 107.5 | 107.9 | 101.6 |
| 2014 | 93.2 | 98.9 | 97.6 | 100.8 | 102.8 | 100.9 | 104.4 | 105.3 | 98.9 | 104.4 | 102.3 | 98.3 |
| 2015 | 87.0 | 96.7 | 93.3 | 102.6 | 104.3 | 103.0 | 107.9 | 100.5 | 94.4 | 95.5 | 94.9 | 89.8 |
| 2016 | 85.8 | 86.6 | 89.9 | 93.8 | 93.5 | 103.6 | 104.9 | 100.5 | 96.9 | 94.5 | 93.7 | 91.2 |
| 2017 | 84.6 | 87.9 | 93.5 | 98.0 | 95.7 | 99.0 | 100.5 | 99.2 | 88.4 | 90.9 | 87.6 | 86.5 |
| 2018 | 78.0 | 78.1 | 54.6 | 54.4 | 63.7 | 63.6 | 64.1 | 65.7 | 59.7 | 56.2 | 53.3 | 52.4 |
| 2019 | 48.4 | 49.4 | 51.1 | 51.7 | 51.2 | 53.0 | 56.1 | 59.5 | 54.0 | 58.2 | 53.8 | 52.6 |
| 2020 | 50.5 | 50.1 | 45.6 | 34.0 | 44.9 | 59.0 | 61.8 | 59.1 | 58.7 | 54.8 | 48.7 | 46.5 |
| 2021 | 43.5 | 43.0 | 49.3 | 54.7 | 47.5 | 41.3 | 42.5 | 41.2 | 34.8 | 32.8 | 32.0 | 29.9 |
| 2022 | 24.7 | 28.1 | 19.0 | |||||||||
| - = No Data Reported; -- = Not Applicable; NA = Not Available; W = Withheld to avoid disclosure of individual company data. |
| Release Date: 5/19/2022 |
| Next Release Date: TBD |