|
Download Data (XLS File) |
|
||||||||
|
||||||||
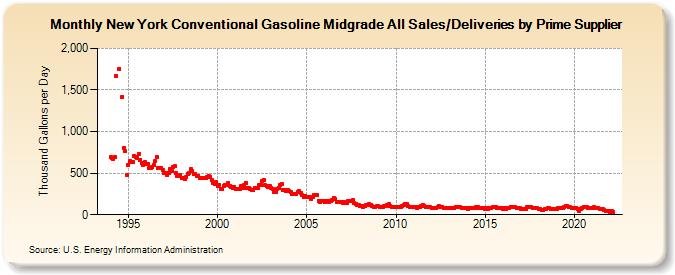
| New York Conventional Gasoline Midgrade All Sales/Deliveries by Prime Supplier (Thousand Gallons per Day) | ||||||||
| Year | Jan | Feb | Mar | Apr | May | Jun | Jul | Aug | Sep | Oct | Nov | Dec |
|---|---|---|---|---|---|---|---|---|---|---|---|---|
| 1993 | NA | NA | NA | |||||||||
| 1994 | 690.4 | 679.6 | 671.4 | 689.5 | 1,662.1 | W | 1,755.0 | W | 1,418.5 | 799.8 | 760.6 | 476.4 |
| 1995 | 602.5 | 644.9 | 631.2 | 633.6 | 704.6 | 695.5 | 686.0 | 734.9 | 661.1 | 622.6 | 602.3 | 629.7 |
| 1996 | 604.7 | 613.4 | 564.8 | 565.0 | 567.8 | 601.9 | 643.7 | 693.4 | 560.0 | 560.9 | 559.6 | 539.6 |
| 1997 | 507.6 | 498.6 | 475.6 | 500.5 | 548.4 | 529.8 | 574.8 | 582.3 | 498.6 | 465.4 | 462.1 | 482.8 |
| 1998 | 439.8 | 438.3 | 430.0 | 454.6 | 487.4 | 504.8 | 548.3 | 528.8 | 484.4 | 491.2 | 466.4 | 466.1 |
| 1999 | 435.6 | 440.4 | 446.8 | W | 439.7 | 452.3 | 469.0 | 458.7 | 411.7 | 386.8 | 368.8 | 398.6 |
| 2000 | 342.4 | 360.2 | 309.7 | 304.7 | 348.5 | 359.8 | 359.2 | 381.4 | 350.0 | 331.2 | 318.9 | 336.6 |
| 2001 | 307.1 | 311.1 | 309.5 | 305.1 | 350.9 | 325.8 | 351.8 | 382.5 | 322.1 | 316.2 | 303.8 | 299.7 |
| 2002 | 292.5 | 326.3 | 323.6 | 317.2 | 354.8 | 360.3 | 402.9 | 415.1 | 353.7 | 349.8 | 337.7 | 344.3 |
| 2003 | 324.2 | 306.6 | 276.6 | 277.1 | 314.4 | 324.3 | 361.6 | 370.5 | 301.7 | 300.8 | 287.1 | 296.9 |
| 2004 | 279.8 | 272.1 | 254.1 | 251.0 | 246.9 | 250.4 | 272.3 | 280.6 | 257.6 | 233.2 | 217.4 | 226.6 |
| 2005 | 216.2 | 214.6 | 209.4 | 194.9 | 212.6 | 232.8 | 239.1 | 235.9 | 169.9 | 156.5 | 161.4 | 162.5 |
| 2006 | 154.1 | 168.0 | 170.5 | 158.2 | 167.0 | 180.7 | 201.4 | 193.8 | 154.3 | 151.7 | 147.6 | 147.0 |
| 2007 | 143.5 | 154.8 | 144.4 | 138.3 | 160.6 | 164.8 | 169.3 | 175.9 | 143.0 | 134.5 | 116.4 | 113.7 |
| 2008 | 103.0 | 99.5 | 96.2 | 102.1 | 114.6 | 112.4 | 128.5 | 121.0 | 102.0 | 95.9 | 89.9 | 99.0 |
| 2009 | 99.0 | 96.0 | 94.9 | 97.5 | 106.7 | 110.7 | 119.9 | 123.9 | 105.5 | 98.2 | 90.9 | 92.2 |
| 2010 | 91.3 | 96.0 | 95.5 | 94.1 | 103.2 | 111.2 | 130.6 | 125.2 | 103.3 | 97.6 | 95.7 | 96.1 |
| 2011 | 90.2 | 91.3 | 86.3 | 87.1 | 90.2 | 106.7 | 114.7 | 107.5 | 94.7 | 93.6 | 91.2 | 89.5 |
| 2012 | 80.6 | 83.0 | 82.2 | 80.9 | 92.4 | 99.1 | 94.0 | 96.2 | 85.3 | 84.4 | 81.3 | 82.4 |
| 2013 | 76.2 | 77.2 | 77.8 | 80.5 | 90.0 | 91.7 | 88.7 | 91.0 | 83.6 | 81.6 | 81.2 | 80.0 |
| 2014 | 72.5 | 77.1 | 75.0 | 76.6 | 83.2 | 85.0 | 87.0 | 95.7 | 81.5 | 80.0 | 75.8 | 75.0 |
| 2015 | 72.4 | 79.4 | 73.5 | 79.6 | 84.0 | 87.2 | 95.4 | 94.3 | 83.2 | 82.0 | 78.3 | 76.8 |
| 2016 | 73.6 | 75.0 | 74.3 | 77.3 | 81.0 | 92.8 | 93.5 | 88.8 | 89.3 | 75.9 | 74.9 | 76.0 |
| 2017 | 66.7 | 71.3 | 73.5 | 74.4 | 89.2 | 86.9 | 89.8 | 91.3 | 78.9 | 80.0 | 75.6 | 75.8 |
| 2018 | 70.5 | 72.0 | 60.5 | 61.0 | 69.1 | 71.1 | 77.7 | 77.8 | 66.8 | 64.9 | 71.4 | 63.5 |
| 2019 | 73.2 | 75.4 | 76.3 | 78.4 | 85.0 | 86.8 | 102.5 | 102.9 | 87.7 | 89.7 | 84.4 | 81.0 |
| 2020 | 80.9 | 82.1 | 68.0 | 48.8 | 66.1 | 86.0 | 93.4 | 96.3 | 88.8 | 84.5 | 77.9 | 76.3 |
| 2021 | 76.6 | 87.2 | 81.4 | 85.2 | 75.4 | 64.9 | 65.5 | 65.3 | 56.2 | 43.9 | 40.2 | 39.4 |
| 2022 | 37.2 | 39.8 | 31.5 | |||||||||
| - = No Data Reported; -- = Not Applicable; NA = Not Available; W = Withheld to avoid disclosure of individual company data. |
| Release Date: 5/19/2022 |
| Next Release Date: TBD |