|
Download Data (XLS File) |
|
||||||||
|
||||||||
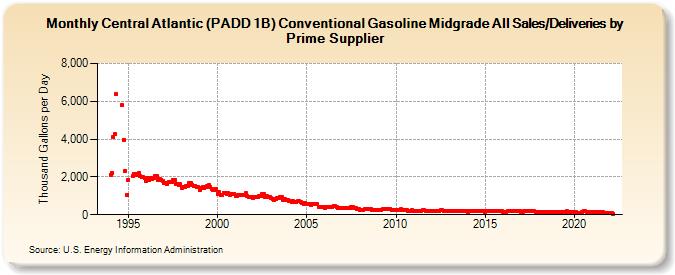
| Central Atlantic (PADD 1B) Conventional Gasoline Midgrade All Sales/Deliveries by Prime Supplier (Thousand Gallons per Day) | ||||||||
| Year | Jan | Feb | Mar | Apr | May | Jun | Jul | Aug | Sep | Oct | Nov | Dec |
|---|---|---|---|---|---|---|---|---|---|---|---|---|
| 1993 | NA | NA | NA | |||||||||
| 1994 | 2,108.3 | 2,218.1 | 4,116.3 | 4,260.1 | 6,369.3 | W | W | W | 5,794.1 | 3,977.0 | 2,335.1 | 1,062.5 |
| 1995 | 1,849.4 | W | W | 2,051.6 | 2,143.0 | 2,141.2 | 2,080.9 | 2,205.1 | 2,022.7 | 1,972.9 | 1,993.7 | 1,936.4 |
| 1996 | 1,789.4 | 1,949.7 | 1,834.9 | 1,920.5 | 1,883.5 | 1,938.7 | 2,037.2 | 2,074.0 | 1,834.8 | 1,876.4 | 1,861.2 | 1,770.8 |
| 1997 | 1,675.9 | 1,657.2 | 1,622.2 | 1,735.1 | 1,745.5 | 1,723.4 | 1,843.7 | 1,816.0 | 1,620.2 | 1,633.1 | 1,572.9 | 1,610.3 |
| 1998 | 1,416.6 | 1,459.5 | 1,441.9 | 1,508.8 | 1,520.2 | 1,680.4 | 1,661.7 | 1,596.3 | 1,501.1 | 1,514.6 | 1,450.9 | 1,473.8 |
| 1999 | 1,306.5 | 1,395.5 | 1,447.1 | 1,421.6 | 1,465.6 | 1,517.8 | 1,554.4 | 1,483.2 | 1,383.3 | 1,332.5 | 1,326.4 | 1,377.6 |
| 2000 | 1,120.9 | 1,213.8 | 1,053.3 | 1,045.1 | 1,168.7 | 1,174.8 | 1,112.0 | 1,159.7 | 1,065.5 | 1,080.7 | 1,071.5 | 1,098.1 |
| 2001 | 980.2 | 983.8 | 1,020.6 | 1,024.9 | 1,056.2 | 1,032.7 | 1,055.3 | 1,134.6 | 990.0 | 959.1 | 943.4 | 940.0 |
| 2002 | 861.1 | 934.1 | 944.4 | 929.1 | 1,005.0 | 1,014.4 | 1,081.3 | 1,100.6 | 962.0 | 980.7 | 946.6 | 955.0 |
| 2003 | 873.0 | 817.8 | 768.2 | 810.2 | 881.3 | 884.9 | 958.3 | 958.2 | 789.6 | 817.2 | 785.8 | 790.4 |
| 2004 | 740.2 | 722.3 | 697.4 | 707.1 | 671.2 | 647.4 | 706.3 | 706.1 | 658.6 | 598.5 | 586.3 | 604.9 |
| 2005 | 547.6 | 564.3 | 542.0 | 504.3 | 541.7 | 575.9 | 567.5 | 553.3 | 412.6 | 395.1 | 411.8 | 415.0 |
| 2006 | 360.7 | 397.6 | 409.0 | 387.8 | 398.7 | 429.8 | 463.2 | 450.8 | 382.3 | 371.4 | 367.2 | 361.9 |
| 2007 | 345.4 | 365.3 | 345.0 | 347.6 | 379.7 | 380.1 | 385.5 | 401.6 | 341.2 | 329.2 | 290.8 | 296.7 |
| 2008 | 270.3 | 266.3 | 271.4 | 277.4 | 297.6 | 293.9 | 316.3 | 317.0 | 272.7 | 271.7 | 259.0 | 271.6 |
| 2009 | 258.2 | 254.0 | 270.6 | 283.2 | 296.0 | 301.8 | 321.9 | 324.8 | 292.6 | 273.5 | 251.0 | 263.3 |
| 2010 | 241.2 | 251.8 | 260.9 | 276.2 | 272.6 | 242.8 | 256.9 | 242.2 | 221.1 | 222.6 | 221.8 | 225.0 |
| 2011 | 193.5 | 197.5 | 197.8 | 196.7 | 193.1 | 218.8 | 234.5 | 228.3 | 209.0 | 221.3 | 208.6 | 206.2 |
| 2012 | 182.2 | 189.1 | 191.7 | 191.2 | 205.4 | 221.5 | 223.3 | 223.3 | 194.1 | 201.4 | 196.4 | 186.1 |
| 2013 | 212.3 | 176.3 | 180.8 | 186.7 | 200.1 | 204.5 | 207.4 | 209.5 | 196.5 | 193.7 | 193.0 | 184.9 |
| 2014 | 168.8 | 179.6 | 176.8 | 182.5 | 192.2 | 192.0 | 197.7 | 206.5 | 185.2 | 188.8 | 181.9 | 176.6 |
| 2015 | 162.6 | 179.4 | 170.6 | 187.4 | 194.2 | 196.5 | 211.7 | 202.6 | 182.3 | 181.1 | 176.9 | 170.2 |
| 2016 | 162.5 | 164.6 | 167.4 | 175.9 | 179.6 | 202.8 | 204.4 | 195.5 | 194.5 | 177.0 | 172.9 | 170.9 |
| 2017 | 155.3 | 163.0 | 171.6 | 176.8 | 190.0 | 194.2 | 199.3 | 197.3 | 173.5 | 176.5 | 167.5 | 167.2 |
| 2018 | 152.4 | 154.5 | 118.9 | 119.9 | 139.5 | 141.6 | 148.5 | 150.1 | 131.0 | 125.5 | 128.7 | 119.0 |
| 2019 | 125.3 | 127.7 | 130.5 | 134.8 | 143.4 | 148.2 | 168.9 | 174.0 | 149.0 | 152.6 | 141.9 | 136.6 |
| 2020 | 134.4 | 135.1 | 117.1 | 86.0 | 116.3 | 155.9 | 171.9 | 171.0 | 157.9 | 145.5 | 130.8 | 126.6 |
| 2021 | 123.5 | 133.5 | 134.7 | 146.3 | 132.6 | 116.6 | 123.7 | 121.0 | 98.6 | 82.3 | 75.5 | 73.1 |
| 2022 | 64.5 | 70.9 | 53.1 | |||||||||
| - = No Data Reported; -- = Not Applicable; NA = Not Available; W = Withheld to avoid disclosure of individual company data. |
| Release Date: 5/19/2022 |
| Next Release Date: TBD |