|
Download Data (XLS File) |
|
||||||||
|
||||||||
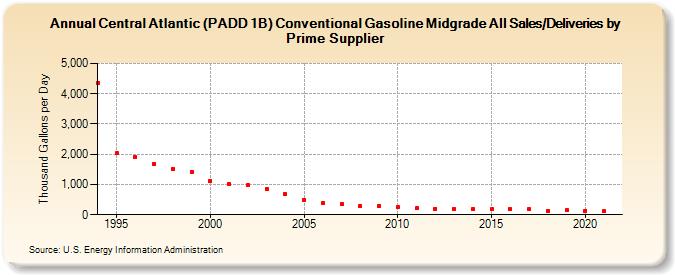
| Central Atlantic (PADD 1B) Conventional Gasoline Midgrade All Sales/Deliveries by Prime Supplier (Thousand Gallons per Day) | ||||||||
| Decade | Year-0 | Year-1 | Year-2 | Year-3 | Year-4 | Year-5 | Year-6 | Year-7 | Year-8 | Year-9 |
|---|---|---|---|---|---|---|---|---|---|---|
| 1990's | 4,355.0 | 2,031.4 | 1,897.7 | 1,688.5 | 1,519.1 | 1,417.9 | ||||
| 2000's | 1,113.4 | 1,010.4 | 976.7 | 845.1 | 670.5 | 502.4 | 398.4 | 350.7 | 282.2 | 282.8 |
| 2010's | 244.6 | 208.9 | 200.5 | 195.6 | 185.8 | 184.7 | 180.7 | 177.8 | 135.7 | 144.6 |
| 2020's | 137.4 |
| - = No Data Reported; -- = Not Applicable; NA = Not Available; W = Withheld to avoid disclosure of individual company data. |
| Release Date: 6/1/2022 |
| Next Release Date: TBD |