|
Download Data (XLS File) |
|
||||||||
|
||||||||
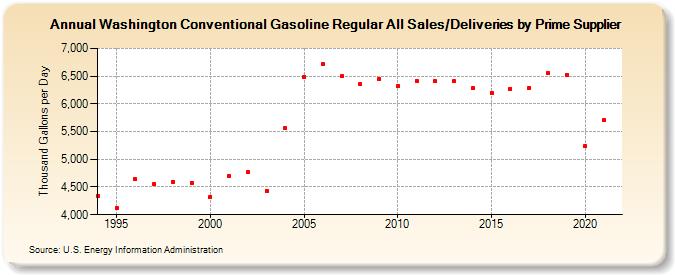
| Washington Conventional Gasoline Regular All Sales/Deliveries by Prime Supplier (Thousand Gallons per Day) | ||||||||
| Decade | Year-0 | Year-1 | Year-2 | Year-3 | Year-4 | Year-5 | Year-6 | Year-7 | Year-8 | Year-9 |
|---|---|---|---|---|---|---|---|---|---|---|
| 1990's | 4,343.3 | 4,121.2 | 4,639.4 | 4,555.8 | 4,597.1 | 4,578.2 | ||||
| 2000's | 4,326.3 | 4,703.3 | 4,767.5 | 4,434.6 | 5,560.4 | 6,491.9 | 6,714.2 | 6,501.3 | 6,352.5 | 6,445.3 |
| 2010's | 6,322.7 | 6,419.0 | 6,406.7 | 6,405.2 | 6,283.9 | 6,201.0 | 6,274.5 | 6,293.1 | 6,553.6 | 6,524.4 |
| 2020's | 5,241.4 |
| - = No Data Reported; -- = Not Applicable; NA = Not Available; W = Withheld to avoid disclosure of individual company data. |
| Release Date: 6/1/2022 |
| Next Release Date: TBD |