|
Download Data (XLS File) |
|
||||||||
|
||||||||
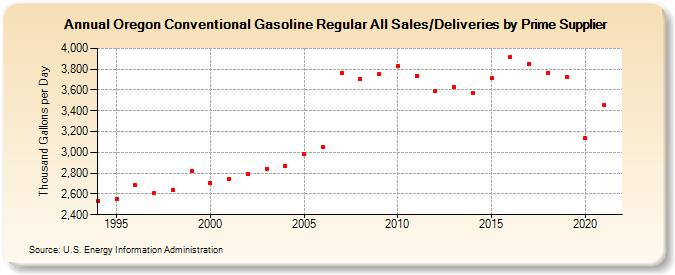
| Oregon Conventional Gasoline Regular All Sales/Deliveries by Prime Supplier (Thousand Gallons per Day) | ||||||||
| Decade | Year-0 | Year-1 | Year-2 | Year-3 | Year-4 | Year-5 | Year-6 | Year-7 | Year-8 | Year-9 |
|---|---|---|---|---|---|---|---|---|---|---|
| 1990's | 2,527.4 | 2,555.0 | 2,685.8 | 2,605.5 | 2,638.0 | 2,824.6 | ||||
| 2000's | 2,701.0 | 2,746.9 | 2,792.0 | 2,841.3 | 2,871.4 | 2,980.6 | 3,054.5 | 3,767.2 | 3,703.4 | 3,748.9 |
| 2010's | 3,833.1 | 3,734.4 | 3,592.8 | 3,624.5 | 3,570.2 | 3,717.5 | 3,917.8 | 3,851.1 | 3,763.5 | 3,724.9 |
| 2020's | 3,137.2 |
| - = No Data Reported; -- = Not Applicable; NA = Not Available; W = Withheld to avoid disclosure of individual company data. |
| Release Date: 6/1/2022 |
| Next Release Date: TBD |