|
Download Data (XLS File) |
|
||||||||
|
||||||||
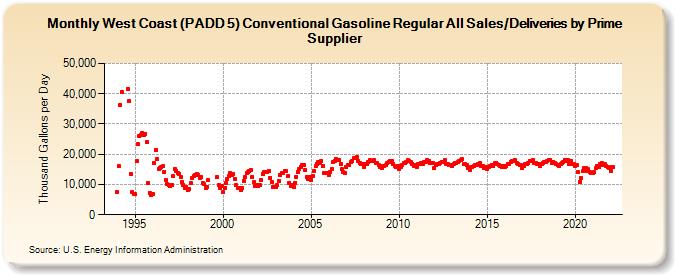
| West Coast (PADD 5) Conventional Gasoline Regular All Sales/Deliveries by Prime Supplier (Thousand Gallons per Day) | ||||||||
| Year | Jan | Feb | Mar | Apr | May | Jun | Jul | Aug | Sep | Oct | Nov | Dec |
|---|---|---|---|---|---|---|---|---|---|---|---|---|
| 1993 | NA | NA | NA | |||||||||
| 1994 | 7,548.3 | 15,997.1 | 36,242.5 | 40,648.1 | W | W | W | 41,725.5 | 37,536.5 | 13,586.4 | 7,371.2 | 6,937.2 |
| 1995 | 6,683.3 | 17,695.0 | 23,227.9 | 25,938.6 | 26,487.5 | 27,090.2 | 26,445.6 | 26,840.5 | 24,119.4 | 10,476.3 | 7,250.0 | 6,546.9 |
| 1996 | 6,772.5 | 17,001.6 | 21,356.5 | 18,304.0 | 15,113.3 | 15,448.8 | 15,787.3 | 15,988.5 | 14,273.1 | 11,369.1 | 9,990.1 | 9,749.5 |
| 1997 | 9,442.4 | 9,897.9 | 12,708.9 | 15,114.4 | 14,382.5 | 13,888.4 | 13,580.5 | 12,592.3 | 10,865.4 | 9,939.5 | 8,889.9 | 9,154.4 |
| 1998 | 8,225.4 | 8,640.6 | 10,437.4 | 12,169.1 | 12,674.6 | 13,254.7 | 13,578.5 | 13,248.2 | 12,243.0 | 12,553.5 | 10,541.2 | 10,077.6 |
| 1999 | 8,907.1 | 9,199.5 | 11,385.9 | W | W | W | W | W | 12,445.1 | 9,821.3 | 8,953.8 | 9,468.3 |
| 2000 | 7,510.4 | 8,742.6 | 10,421.7 | 11,901.9 | 12,822.4 | 13,735.8 | 13,285.2 | 13,447.8 | 11,935.1 | 9,802.0 | 8,911.5 | 8,854.5 |
| 2001 | 8,163.1 | 8,936.5 | 11,114.9 | 12,464.1 | 13,703.3 | 14,099.6 | 14,378.5 | 14,714.4 | 12,517.1 | 10,801.6 | 9,606.0 | 9,661.1 |
| 2002 | 9,539.9 | 9,725.0 | 11,394.0 | 13,511.3 | 14,199.4 | 14,055.7 | 14,012.4 | 14,314.7 | 12,138.4 | 10,775.4 | 9,263.8 | 9,160.6 |
| 2003 | 9,024.8 | 9,708.4 | 11,070.4 | 13,156.5 | 13,655.5 | 13,878.9 | 14,407.1 | 14,298.2 | 12,842.0 | 10,538.2 | 9,546.0 | 9,731.2 |
| 2004 | 9,264.5 | 10,594.0 | 12,547.8 | 14,197.3 | 15,222.8 | 15,930.2 | 16,440.9 | 16,355.5 | 14,791.3 | 12,417.4 | 11,935.7 | 12,306.5 |
| 2005 | 11,598.0 | 12,720.9 | 14,570.6 | 16,018.9 | 16,825.4 | 17,432.0 | 17,044.4 | 17,823.6 | 16,184.8 | 13,830.8 | 13,734.9 | 13,643.1 |
| 2006 | 13,036.7 | 14,198.3 | 15,239.0 | 17,345.7 | 17,709.6 | 18,347.5 | 17,945.5 | 18,192.8 | 16,800.5 | 14,991.6 | 13,962.5 | 13,822.2 |
| 2007 | 15,720.4 | 16,383.1 | 16,398.4 | 17,289.7 | 17,801.9 | 18,663.2 | 18,632.1 | 18,916.8 | 17,824.3 | 17,162.5 | 16,634.7 | 16,758.3 |
| 2008 | 15,910.8 | 16,609.3 | 16,689.5 | 17,391.7 | 18,041.4 | 17,728.5 | 17,903.5 | 18,046.3 | 17,230.6 | 17,024.0 | 16,592.6 | 15,670.6 |
| 2009 | 15,312.5 | 15,973.8 | 16,120.0 | 16,351.9 | 17,015.8 | 17,518.2 | 17,674.7 | 17,673.7 | 16,925.1 | 16,212.7 | 15,797.4 | 16,193.3 |
| 2010 | 14,962.8 | 15,801.5 | 16,486.9 | 16,934.6 | 17,073.5 | 17,517.0 | 17,993.5 | 17,869.3 | 17,337.7 | 16,784.0 | 16,205.4 | 16,590.3 |
| 2011 | 15,886.7 | 16,726.1 | 16,623.1 | 17,037.5 | 16,799.3 | 17,322.8 | 17,564.5 | 17,957.2 | 17,793.9 | 17,150.2 | 17,105.3 | 17,163.9 |
| 2012 | 15,448.6 | 16,377.2 | 16,619.3 | 16,713.9 | 17,068.6 | 17,369.7 | 17,377.3 | 18,065.9 | 16,865.1 | 16,845.7 | 16,550.6 | 16,313.4 |
| 2013 | 16,199.3 | 16,624.0 | 16,964.5 | 17,095.6 | 17,374.4 | 17,687.3 | 18,044.1 | 18,292.5 | 16,632.3 | 16,765.9 | 16,292.4 | 15,412.6 |
| 2014 | 14,892.5 | 15,821.9 | 15,914.7 | 16,020.2 | 16,371.9 | 16,526.4 | 16,854.2 | 16,957.2 | 16,012.3 | 16,054.3 | 15,366.8 | 15,670.5 |
| 2015 | 15,271.1 | 15,763.6 | 16,177.1 | 16,418.1 | 16,254.9 | 16,960.0 | 17,150.3 | 16,629.6 | 16,353.6 | 16,160.0 | 15,685.3 | 16,125.3 |
| 2016 | 15,616.5 | 16,073.9 | 16,661.0 | 16,823.7 | 17,351.5 | 17,868.3 | 17,739.5 | 18,114.1 | 17,030.2 | 16,656.4 | 16,427.9 | 16,304.3 |
| 2017 | 15,289.8 | 15,958.6 | 16,799.9 | 16,866.0 | 17,206.6 | 17,854.9 | 17,693.0 | 17,969.0 | 17,113.7 | 17,059.2 | 16,906.2 | 16,852.1 |
| 2018 | 16,117.8 | 16,816.7 | 16,948.3 | 17,267.5 | 17,304.2 | 17,907.3 | 18,063.7 | 18,036.1 | 16,950.8 | 17,592.0 | 17,225.3 | 16,759.7 |
| 2019 | 16,550.5 | 16,122.8 | 16,814.9 | 17,086.8 | 17,429.8 | 18,192.2 | 17,841.0 | 17,969.4 | 16,767.7 | 17,599.7 | 16,867.2 | 16,694.1 |
| 2020 | 16,031.6 | 16,316.0 | 14,086.2 | 10,903.2 | 12,059.3 | 14,416.7 | 15,322.3 | 15,364.3 | 14,550.3 | 15,025.9 | 13,959.8 | 13,895.9 |
| 2021 | 13,776.8 | 13,959.3 | 15,326.8 | 16,013.9 | 15,906.9 | 16,636.0 | 17,228.5 | 16,582.3 | 16,671.9 | 16,149.4 | 15,889.2 | 15,525.4 |
| 2022 | 14,602.2 | 15,772.7 | 15,710.3 | |||||||||
| - = No Data Reported; -- = Not Applicable; NA = Not Available; W = Withheld to avoid disclosure of individual company data. |
| Release Date: 5/19/2022 |
| Next Release Date: TBD |