|
Download Data (XLS File) |
|
||||||||
|
||||||||
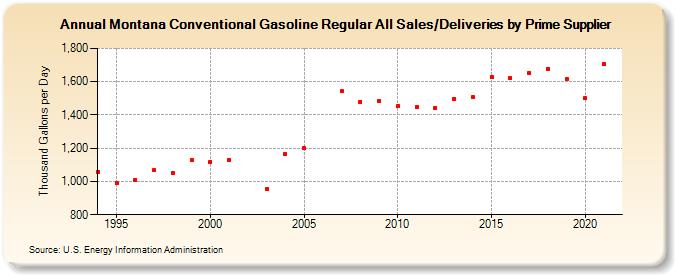
| Montana Conventional Gasoline Regular All Sales/Deliveries by Prime Supplier (Thousand Gallons per Day) | ||||||||
| Decade | Year-0 | Year-1 | Year-2 | Year-3 | Year-4 | Year-5 | Year-6 | Year-7 | Year-8 | Year-9 |
|---|---|---|---|---|---|---|---|---|---|---|
| 1990's | 1,059.8 | 991.9 | 1,009.2 | 1,065.9 | 1,047.9 | 1,128.8 | ||||
| 2000's | 1,118.1 | 1,130.0 | W | 954.6 | 1,166.8 | 1,198.4 | W | 1,541.5 | 1,479.5 | 1,484.7 |
| 2010's | 1,454.1 | 1,447.8 | 1,444.4 | 1,498.7 | 1,506.7 | 1,627.3 | 1,622.2 | 1,651.2 | 1,678.9 | 1,615.2 |
| 2020's | 1,499.6 |
| - = No Data Reported; -- = Not Applicable; NA = Not Available; W = Withheld to avoid disclosure of individual company data. |
| Release Date: 6/1/2022 |
| Next Release Date: TBD |