|
Download Data (XLS File) |
|
||||||||
|
||||||||
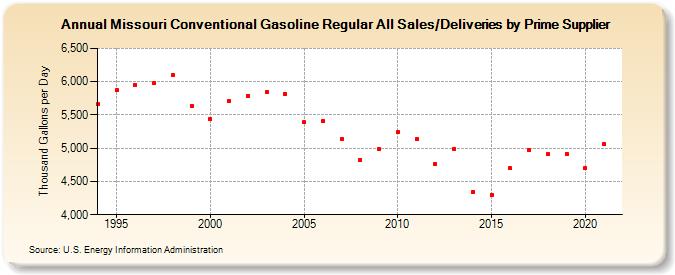
| Missouri Conventional Gasoline Regular All Sales/Deliveries by Prime Supplier (Thousand Gallons per Day) | ||||||||
| Decade | Year-0 | Year-1 | Year-2 | Year-3 | Year-4 | Year-5 | Year-6 | Year-7 | Year-8 | Year-9 |
|---|---|---|---|---|---|---|---|---|---|---|
| 1990's | 5,663.9 | 5,867.5 | 5,948.1 | 5,975.9 | 6,106.8 | 5,640.2 | ||||
| 2000's | 5,432.4 | 5,704.5 | 5,788.5 | 5,841.5 | 5,818.0 | 5,389.7 | 5,406.8 | 5,144.2 | 4,829.4 | 4,988.5 |
| 2010's | 5,240.3 | 5,132.0 | 4,761.5 | 4,993.1 | 4,348.2 | 4,303.0 | 4,695.3 | 4,976.2 | 4,908.3 | 4,915.6 |
| 2020's | 4,696.1 |
| - = No Data Reported; -- = Not Applicable; NA = Not Available; W = Withheld to avoid disclosure of individual company data. |
| Release Date: 6/1/2022 |
| Next Release Date: TBD |