|
Download Data (XLS File) |
|
||||||||
|
||||||||
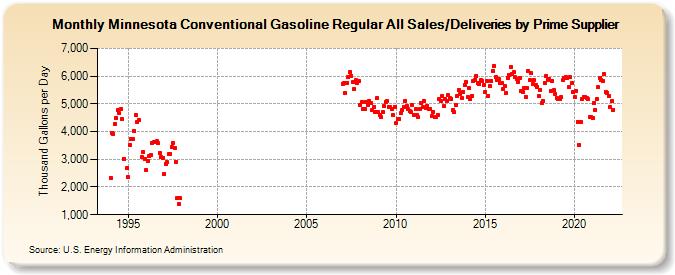
| Minnesota Conventional Gasoline Regular All Sales/Deliveries by Prime Supplier (Thousand Gallons per Day) | ||||||||
| Year | Jan | Feb | Mar | Apr | May | Jun | Jul | Aug | Sep | Oct | Nov | Dec |
|---|---|---|---|---|---|---|---|---|---|---|---|---|
| 1993 | NA | NA | NA | |||||||||
| 1994 | 2,337.1 | 3,947.8 | 3,924.3 | 4,289.9 | 4,492.0 | 4,765.3 | 4,655.8 | 4,822.1 | 4,440.1 | 3,023.4 | W | 2,667.5 |
| 1995 | 2,348.6 | 3,523.5 | 3,734.9 | 3,713.3 | 4,021.3 | 4,597.7 | 4,329.0 | 4,404.8 | W | 3,090.2 | 3,244.7 | 3,007.6 |
| 1996 | 2,614.2 | 2,947.1 | 3,100.5 | 3,140.6 | 3,591.3 | 3,610.2 | W | 3,646.1 | 3,577.7 | 3,232.0 | 3,094.2 | 3,063.7 |
| 1997 | 2,471.8 | 2,833.9 | 2,888.9 | 3,185.8 | 3,204.9 | 3,444.5 | 3,589.0 | 3,415.0 | 2,916.4 | 1,588.1 | 1,391.4 | 1,587.6 |
| 1998 | - | - | - | - | - | - | - | - | - | - | - | - |
| 1999 | - | - | - | - | - | - | - | - | - | - | - | - |
| 2000 | - | - | - | - | - | - | - | - | - | - | - | - |
| 2001 | - | - | - | - | - | - | - | - | - | - | - | - |
| 2002 | - | - | - | - | - | - | - | - | - | - | - | - |
| 2003 | - | - | - | - | - | - | - | - | - | - | - | - |
| 2004 | - | - | - | - | - | - | - | - | - | - | - | - |
| 2005 | - | - | - | - | - | - | - | - | - | - | - | - |
| 2006 | - | - | - | - | - | - | - | - | - | - | - | - |
| 2007 | 5,728.6 | 5,736.4 | 5,375.6 | 5,753.4 | 5,960.9 | 6,153.6 | 6,018.7 | 5,788.4 | 5,533.1 | 5,846.7 | 5,762.2 | 5,820.7 |
| 2008 | 4,960.4 | 5,070.7 | 4,829.8 | 4,809.7 | 5,080.2 | 4,940.5 | 5,104.8 | 5,024.1 | 4,770.8 | 4,893.1 | 4,700.6 | 5,206.3 |
| 2009 | 4,716.8 | 4,608.8 | 4,514.9 | 4,709.3 | 4,913.4 | 5,066.3 | 5,092.1 | 4,900.1 | 4,873.9 | 4,799.1 | 4,595.6 | 4,898.5 |
| 2010 | 4,291.7 | 4,469.0 | 4,462.1 | 4,658.7 | 4,778.8 | 4,881.3 | 5,093.6 | 4,917.2 | 4,831.3 | 4,732.3 | 4,704.6 | 4,961.7 |
| 2011 | 4,585.6 | 4,801.1 | 4,582.9 | 4,514.7 | 4,805.2 | 5,047.4 | 4,879.2 | 5,096.6 | 4,865.6 | 4,933.0 | 4,808.5 | 4,821.0 |
| 2012 | 4,561.0 | 4,723.1 | 4,538.8 | 4,511.4 | 4,602.9 | 5,173.4 | 5,111.4 | 5,276.4 | 4,910.0 | 5,186.9 | 5,090.0 | 5,305.6 |
| 2013 | 5,193.8 | 5,181.7 | 4,772.5 | 4,694.7 | 4,950.6 | 5,271.6 | 5,502.6 | 5,368.6 | 5,216.7 | 5,439.0 | 5,678.1 | 5,789.5 |
| 2014 | 5,243.3 | 5,569.5 | 5,159.5 | 5,292.4 | 5,806.8 | 5,863.5 | 6,018.2 | 5,758.5 | 5,704.4 | 5,846.7 | 5,839.0 | 5,674.4 |
| 2015 | 5,429.7 | 5,834.6 | 5,299.9 | 5,643.9 | 5,822.5 | 6,194.3 | 6,362.8 | 5,972.4 | 5,859.6 | 5,893.6 | 5,758.9 | 5,734.8 |
| 2016 | 5,535.3 | 5,632.4 | 5,408.3 | 5,940.4 | 6,050.7 | 6,344.0 | 6,087.6 | 6,135.6 | 5,964.3 | 5,906.8 | 5,805.2 | 5,936.7 |
| 2017 | 5,464.5 | 5,444.8 | 5,563.1 | 5,259.7 | 5,581.2 | 6,186.3 | 5,848.4 | 6,101.6 | 5,707.8 | 5,849.8 | 5,685.5 | 5,622.9 |
| 2018 | 5,286.9 | 5,504.7 | 5,032.3 | 5,104.9 | 5,761.7 | 5,996.6 | 5,872.5 | 5,882.0 | 5,461.5 | 5,825.1 | 5,486.3 | 5,361.2 |
| 2019 | 5,223.5 | 5,182.0 | 5,178.6 | 5,234.3 | 5,850.0 | 5,949.6 | 5,967.4 | 5,937.6 | 5,602.3 | 5,956.1 | 5,739.7 | 5,427.8 |
| 2020 | 5,241.7 | 5,463.5 | 4,362.2 | 3,532.7 | 4,347.4 | 5,182.0 | 5,262.2 | 5,257.0 | 5,212.8 | 5,161.5 | 4,511.1 | 4,533.9 |
| 2021 | 4,487.5 | 5,031.0 | 4,785.5 | 5,160.4 | 5,598.1 | 5,919.6 | 5,858.6 | 5,822.8 | 6,068.0 | 5,438.1 | 5,408.0 | 5,286.9 |
| 2022 | 4,881.8 | 5,088.6 | 4,783.9 | |||||||||
| - = No Data Reported; -- = Not Applicable; NA = Not Available; W = Withheld to avoid disclosure of individual company data. |
| Release Date: 5/19/2022 |
| Next Release Date: TBD |