|
Download Data (XLS File) |
|
||||||||
|
||||||||
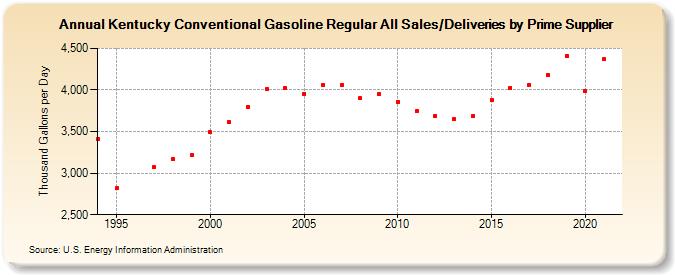
| Kentucky Conventional Gasoline Regular All Sales/Deliveries by Prime Supplier (Thousand Gallons per Day) | ||||||||
| Decade | Year-0 | Year-1 | Year-2 | Year-3 | Year-4 | Year-5 | Year-6 | Year-7 | Year-8 | Year-9 |
|---|---|---|---|---|---|---|---|---|---|---|
| 1990's | 3,409.5 | 2,818.2 | W | 3,069.7 | 3,165.0 | 3,214.5 | ||||
| 2000's | 3,489.5 | 3,610.2 | 3,792.9 | 4,005.8 | 4,020.1 | 3,956.7 | 4,061.7 | 4,061.1 | 3,902.9 | 3,946.3 |
| 2010's | 3,860.9 | 3,746.4 | 3,690.5 | 3,647.9 | 3,683.2 | 3,880.9 | 4,029.6 | 4,057.5 | 4,180.4 | 4,411.3 |
| 2020's | 3,991.1 |
| - = No Data Reported; -- = Not Applicable; NA = Not Available; W = Withheld to avoid disclosure of individual company data. |
| Release Date: 6/1/2022 |
| Next Release Date: TBD |