|
Download Data (XLS File) |
|
||||||||
|
||||||||
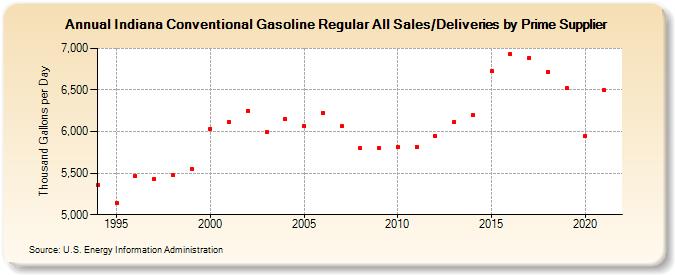
| Indiana Conventional Gasoline Regular All Sales/Deliveries by Prime Supplier (Thousand Gallons per Day) | ||||||||
| Decade | Year-0 | Year-1 | Year-2 | Year-3 | Year-4 | Year-5 | Year-6 | Year-7 | Year-8 | Year-9 |
|---|---|---|---|---|---|---|---|---|---|---|
| 1990's | 5,363.2 | 5,140.1 | 5,463.4 | 5,434.3 | 5,480.2 | 5,555.4 | ||||
| 2000's | 6,031.5 | 6,115.2 | 6,252.8 | 5,989.0 | 6,156.8 | 6,066.8 | 6,228.6 | 6,062.1 | 5,797.1 | 5,799.5 |
| 2010's | 5,817.0 | 5,817.3 | 5,941.8 | 6,120.7 | 6,196.1 | 6,728.0 | 6,935.4 | 6,889.4 | 6,721.7 | 6,519.2 |
| 2020's | 5,947.0 |
| - = No Data Reported; -- = Not Applicable; NA = Not Available; W = Withheld to avoid disclosure of individual company data. |
| Release Date: 6/1/2022 |
| Next Release Date: TBD |