|
Download Data (XLS File) |
|
||||||||
|
||||||||
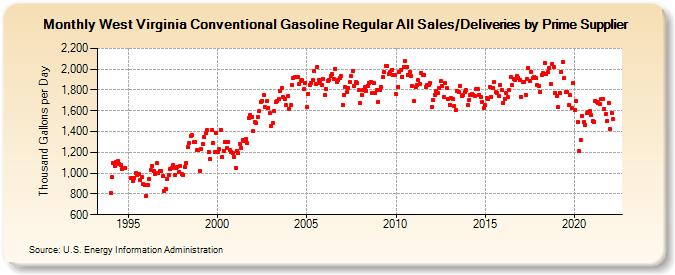
| West Virginia Conventional Gasoline Regular All Sales/Deliveries by Prime Supplier (Thousand Gallons per Day) | ||||||||
| Year | Jan | Feb | Mar | Apr | May | Jun | Jul | Aug | Sep | Oct | Nov | Dec |
|---|---|---|---|---|---|---|---|---|---|---|---|---|
| 1993 | NA | NA | NA | |||||||||
| 1994 | 811.1 | 959.4 | 1,101.2 | 1,071.2 | 1,102.9 | 1,114.3 | 1,088.7 | 1,076.3 | 1,039.3 | W | 1,046.0 | W |
| 1995 | W | W | 956.6 | 923.9 | 951.4 | 1,001.7 | 980.8 | 987.2 | 938.3 | 958.5 | 892.9 | 887.0 |
| 1996 | 780.9 | 887.3 | 945.1 | 1,029.9 | 1,072.1 | 1,016.1 | 989.3 | 1,102.2 | 997.1 | 1,019.1 | 1,018.3 | 972.1 |
| 1997 | 830.2 | 852.1 | 947.6 | 980.4 | 1,036.9 | 1,050.1 | 1,075.6 | 984.2 | 1,048.2 | 1,058.3 | 1,014.4 | 1,072.6 |
| 1998 | 987.3 | 982.4 | 1,058.6 | 1,100.2 | 1,247.2 | 1,289.9 | 1,356.4 | 1,365.6 | 1,301.9 | 1,296.2 | 1,218.5 | 1,224.6 |
| 1999 | 1,023.4 | 1,229.3 | 1,284.1 | 1,346.5 | 1,383.3 | 1,411.9 | 1,199.1 | 1,133.5 | 1,417.2 | 1,288.9 | 1,199.6 | 1,390.2 |
| 2000 | 1,204.8 | 1,230.3 | 1,417.9 | 1,158.3 | 1,214.5 | 1,302.0 | 1,245.9 | 1,304.0 | 1,222.5 | 1,207.8 | 1,191.9 | 1,159.4 |
| 2001 | 1,052.3 | 1,216.5 | 1,192.1 | 1,278.6 | 1,246.4 | 1,315.3 | 1,309.6 | 1,328.9 | 1,285.8 | 1,531.2 | 1,555.9 | 1,542.4 |
| 2002 | 1,402.5 | 1,488.9 | 1,483.9 | 1,540.2 | 1,594.1 | 1,688.0 | 1,696.2 | 1,747.0 | 1,631.9 | 1,694.2 | 1,622.5 | 1,575.4 |
| 2003 | 1,457.9 | 1,483.5 | 1,593.7 | 1,681.4 | 1,689.5 | 1,708.4 | 1,788.6 | 1,817.2 | 1,733.3 | 1,712.8 | 1,652.5 | 1,738.9 |
| 2004 | 1,615.5 | 1,655.3 | 1,843.2 | 1,916.4 | 1,923.6 | 1,929.5 | 1,926.3 | 1,858.5 | 1,888.0 | 1,892.4 | 1,807.3 | 1,869.8 |
| 2005 | 1,634.6 | 1,763.2 | 1,851.1 | 1,863.5 | 1,894.5 | 1,978.3 | 1,859.6 | 2,023.5 | 1,896.3 | 1,867.3 | 1,851.1 | 1,907.5 |
| 2006 | 1,752.8 | 1,811.6 | 1,891.0 | 1,897.3 | 1,934.5 | 1,957.8 | 1,908.1 | 1,997.8 | 1,873.8 | 1,894.7 | 1,917.1 | 1,930.2 |
| 2007 | 1,659.8 | 1,752.1 | 1,830.5 | 1,779.9 | 1,816.8 | 1,878.2 | 1,933.3 | 1,978.9 | 1,837.1 | 1,875.4 | 1,865.7 | 1,798.9 |
| 2008 | 1,670.3 | 1,755.0 | 1,802.3 | 1,824.0 | 1,791.7 | 1,841.1 | 1,871.5 | 1,878.6 | 1,772.1 | 1,868.8 | 1,773.0 | 1,800.4 |
| 2009 | 1,687.5 | 1,802.7 | 1,831.5 | 1,927.0 | 1,971.7 | 2,032.2 | 2,028.8 | 1,949.8 | 1,973.6 | 1,993.3 | 1,943.5 | 1,945.4 |
| 2010 | 1,760.9 | 1,831.5 | 1,975.9 | 1,993.8 | 1,928.0 | 2,022.3 | 2,078.3 | 2,018.1 | 1,948.8 | 1,972.0 | 1,933.4 | 1,836.3 |
| 2011 | 1,690.2 | 1,827.5 | 1,852.4 | 1,895.1 | 1,854.1 | 1,965.9 | 1,947.2 | 1,942.7 | 1,826.8 | 1,850.6 | 1,850.7 | 1,866.7 |
| 2012 | 1,637.9 | 1,701.0 | 1,755.1 | 1,794.2 | 1,766.8 | 1,817.5 | 1,885.0 | 1,841.4 | 1,736.0 | 1,866.0 | 1,821.8 | 1,711.9 |
| 2013 | 1,658.5 | 1,726.7 | 1,715.7 | 1,646.5 | 1,605.6 | 1,792.2 | 1,777.1 | 1,840.2 | 1,742.9 | 1,749.7 | 1,775.7 | 1,800.1 |
| 2014 | 1,653.6 | 1,707.1 | 1,747.0 | 1,762.0 | 1,750.6 | 1,744.8 | 1,805.8 | 1,807.8 | 1,754.7 | 1,737.0 | 1,682.6 | 1,627.5 |
| 2015 | 1,651.7 | 1,718.9 | 1,711.7 | 1,832.0 | 1,735.1 | 1,820.7 | 1,874.5 | 1,777.5 | 1,771.8 | 1,738.5 | 1,849.9 | 1,801.0 |
| 2016 | 1,677.7 | 1,716.9 | 1,774.1 | 1,732.1 | 1,799.0 | 1,921.3 | 1,850.2 | 1,904.9 | 1,900.6 | 1,934.5 | 1,919.5 | 1,898.3 |
| 2017 | 1,736.8 | 1,879.9 | 1,874.9 | 1,754.9 | 1,901.2 | 2,012.2 | 1,887.9 | 1,977.4 | 1,910.7 | 1,929.5 | 1,915.3 | 1,847.8 |
| 2018 | 1,839.6 | 1,782.1 | 1,947.0 | 1,961.8 | 2,062.3 | 1,952.1 | 1,969.1 | 2,012.3 | 1,856.4 | 2,054.0 | 2,024.7 | 1,772.3 |
| 2019 | 1,744.2 | 1,631.9 | 1,774.5 | 1,971.2 | 2,069.7 | 1,913.5 | 1,777.7 | 1,780.1 | 1,654.3 | 1,749.2 | 1,629.7 | 1,868.5 |
| 2020 | 1,605.0 | 1,695.7 | 1,491.8 | 1,209.4 | 1,319.9 | 1,550.2 | 1,490.4 | 1,466.9 | 1,575.8 | 1,584.4 | 1,594.2 | 1,555.0 |
| 2021 | 1,500.1 | 1,496.4 | 1,693.0 | 1,685.7 | 1,672.9 | 1,668.6 | 1,715.2 | 1,708.4 | 1,620.1 | 1,570.9 | 1,505.7 | 1,676.0 |
| 2022 | 1,422.1 | 1,582.1 | 1,517.0 | |||||||||
| - = No Data Reported; -- = Not Applicable; NA = Not Available; W = Withheld to avoid disclosure of individual company data. |
| Release Date: 5/19/2022 |
| Next Release Date: TBD |