|
Download Data (XLS File) |
|
||||||||
|
||||||||
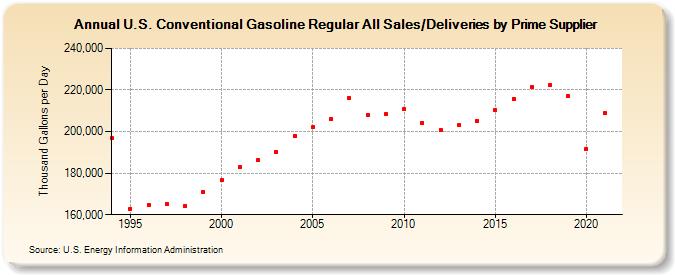
| U.S. Conventional Gasoline Regular All Sales/Deliveries by Prime Supplier (Thousand Gallons per Day) | ||||||||
| Decade | Year-0 | Year-1 | Year-2 | Year-3 | Year-4 | Year-5 | Year-6 | Year-7 | Year-8 | Year-9 |
|---|---|---|---|---|---|---|---|---|---|---|
| 1990's | 196,713.6 | 162,882.7 | 164,775.9 | 165,108.7 | 164,307.8 | 170,969.7 | ||||
| 2000's | 176,599.9 | 182,733.6 | 186,322.6 | 190,364.7 | 197,821.7 | 201,952.0 | 205,919.0 | 216,075.0 | 207,958.8 | 208,347.1 |
| 2010's | 210,638.4 | 204,350.9 | 200,785.6 | 202,964.4 | 205,243.9 | 210,304.0 | 215,728.5 | 221,262.3 | 222,280.1 | 217,041.4 |
| 2020's | 191,523.9 |
| - = No Data Reported; -- = Not Applicable; NA = Not Available; W = Withheld to avoid disclosure of individual company data. |
| Release Date: 6/1/2022 |
| Next Release Date: TBD |