|
Download Data (XLS File) |
|
||||||||
|
||||||||
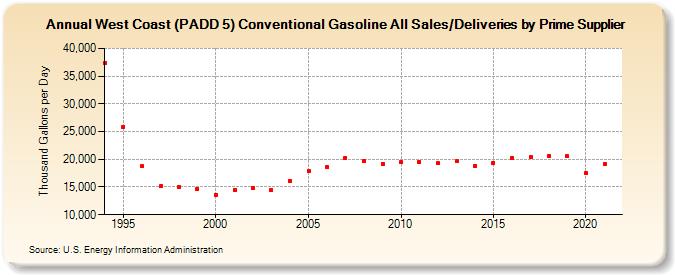
| West Coast (PADD 5) Conventional Gasoline All Sales/Deliveries by Prime Supplier (Thousand Gallons per Day) | ||||||||
| Decade | Year-0 | Year-1 | Year-2 | Year-3 | Year-4 | Year-5 | Year-6 | Year-7 | Year-8 | Year-9 |
|---|---|---|---|---|---|---|---|---|---|---|
| 1990's | 37,421.3 | 25,875.1 | 18,726.2 | 15,130.5 | 15,065.4 | 14,664.1 | ||||
| 2000's | 13,611.9 | 14,494.9 | 14,776.6 | 14,480.6 | 16,099.7 | 17,797.0 | 18,585.8 | 20,271.0 | 19,633.5 | 19,212.3 |
| 2010's | 19,432.9 | 19,554.2 | 19,269.0 | 19,623.5 | 18,759.7 | 19,299.5 | 20,280.8 | 20,334.2 | 20,618.7 | 20,540.2 |
| 2020's | 17,518.4 |
| - = No Data Reported; -- = Not Applicable; NA = Not Available; W = Withheld to avoid disclosure of individual company data. |
| Release Date: 6/1/2022 |
| Next Release Date: TBD |