|
Download Data (XLS File) |
|
||||||||
|
||||||||
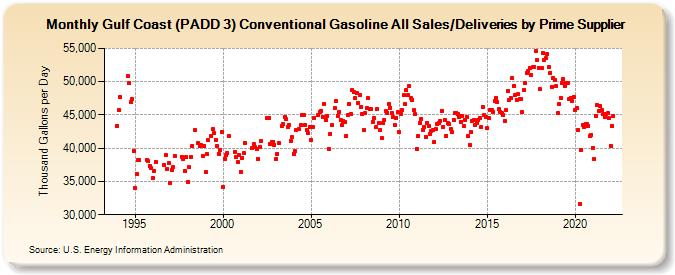
| Gulf Coast (PADD 3) Conventional Gasoline All Sales/Deliveries by Prime Supplier (Thousand Gallons per Day) | ||||||||
| Year | Jan | Feb | Mar | Apr | May | Jun | Jul | Aug | Sep | Oct | Nov | Dec |
|---|---|---|---|---|---|---|---|---|---|---|---|---|
| 1993 | NA | NA | NA | |||||||||
| 1994 | 43,390.3 | 45,717.6 | 47,729.5 | W | W | W | W | 50,802.8 | 49,753.1 | 46,922.2 | 47,325.5 | 39,634.2 |
| 1995 | 33,979.6 | 36,113.0 | 38,197.1 | 38,190.6 | W | W | W | W | 38,235.4 | 38,045.2 | 37,374.3 | 36,955.7 |
| 1996 | 35,444.4 | 36,593.6 | 37,964.1 | W | W | W | W | W | 37,481.3 | 38,974.1 | 36,882.2 | 37,718.2 |
| 1997 | 34,735.9 | 36,775.5 | 37,118.6 | 38,853.1 | W | W | W | W | 38,722.1 | 38,411.3 | 36,637.5 | 38,649.3 |
| 1998 | 34,944.2 | 37,124.9 | 38,670.8 | 40,399.4 | W | 42,687.4 | W | 40,719.3 | 40,327.0 | 40,461.0 | 38,826.0 | 40,381.9 |
| 1999 | 36,396.8 | 39,089.4 | 41,183.3 | W | 41,824.6 | 42,842.4 | 42,215.9 | 41,297.9 | 40,374.3 | 39,185.0 | 39,680.5 | 42,426.7 |
| 2000 | 34,163.2 | 38,443.0 | 38,910.8 | 39,300.3 | 41,880.3 | W | W | W | 39,446.2 | 38,713.3 | 37,882.5 | 38,998.4 |
| 2001 | 36,469.3 | 38,568.4 | 39,292.2 | 40,824.5 | W | W | W | W | 40,082.6 | 40,561.9 | 40,123.8 | 39,927.7 |
| 2002 | 38,440.7 | 40,151.2 | 41,054.7 | W | W | W | 44,464.0 | 44,516.0 | 40,576.1 | 40,923.7 | 40,938.8 | 40,524.4 |
| 2003 | 38,406.6 | 39,144.1 | 40,768.8 | W | 43,367.8 | 43,609.6 | 44,693.9 | 44,313.0 | 43,221.5 | 43,546.0 | 41,092.3 | 41,641.9 |
| 2004 | 39,183.8 | 39,503.2 | 42,737.6 | W | 42,821.1 | 43,485.3 | 44,989.1 | 44,959.3 | 43,433.0 | 42,737.7 | 42,224.5 | 43,257.3 |
| 2005 | 41,157.5 | 43,154.9 | 44,577.9 | W | W | 45,036.0 | 45,439.1 | 45,657.3 | 44,733.1 | 46,633.5 | 44,193.5 | 44,763.4 |
| 2006 | 39,922.8 | 42,179.6 | 43,454.4 | W | 46,046.2 | 47,020.2 | 44,848.6 | 45,467.7 | 44,266.2 | 43,413.0 | 44,126.2 | 43,928.6 |
| 2007 | 41,897.7 | 44,999.5 | 46,664.8 | 45,165.5 | 48,779.8 | 48,424.3 | 47,528.3 | 48,257.7 | 46,842.4 | 47,992.4 | 46,255.1 | 45,097.0 |
| 2008 | 42,807.6 | 45,233.1 | 46,031.5 | 47,516.1 | 45,838.3 | 45,827.4 | 43,979.1 | 44,598.3 | 43,149.7 | 45,834.0 | 43,775.3 | 42,769.8 |
| 2009 | 41,458.9 | 43,713.3 | 44,220.2 | 45,549.9 | 45,348.6 | 46,629.0 | 46,097.1 | 45,306.4 | 44,670.5 | 43,413.3 | 44,538.7 | 45,380.1 |
| 2010 | 42,366.0 | 45,180.8 | 45,765.3 | 47,936.2 | 46,602.3 | 48,724.5 | 47,940.7 | 49,360.5 | 47,557.1 | 47,264.8 | 45,668.0 | 45,082.2 |
| 2011 | 39,906.7 | 41,862.9 | 43,724.7 | 44,427.0 | 42,741.7 | 43,212.6 | 41,744.8 | 43,767.0 | 43,324.8 | 42,145.2 | 42,627.8 | 42,704.8 |
| 2012 | 40,959.0 | 42,903.1 | 43,568.7 | 43,749.9 | 44,092.2 | 45,598.8 | 43,238.5 | 44,238.0 | 41,894.6 | 43,733.0 | 43,592.7 | 42,870.1 |
| 2013 | 42,384.6 | 44,293.0 | 45,340.0 | 45,354.2 | 45,114.5 | 44,721.5 | 43,996.9 | 44,905.5 | 43,351.0 | 44,299.2 | 44,678.5 | 41,773.8 |
| 2014 | 40,511.4 | 42,412.8 | 44,139.4 | 44,302.0 | 43,427.5 | 43,810.1 | 44,197.8 | 44,516.9 | 43,137.7 | 46,263.0 | 44,917.5 | 44,723.7 |
| 2015 | 42,967.3 | 44,472.2 | 45,808.4 | 45,805.5 | 45,450.0 | 47,117.2 | 47,584.8 | 46,923.5 | 45,844.9 | 45,447.6 | 45,286.3 | 45,006.5 |
| 2016 | 44,097.2 | 45,700.2 | 48,653.6 | 47,277.6 | 47,562.6 | 50,542.4 | 49,416.3 | 48,030.4 | 47,316.0 | 48,078.5 | 47,385.4 | 47,423.7 |
| 2017 | 45,425.9 | 48,769.3 | 49,861.1 | 51,363.5 | 51,581.3 | 52,058.7 | 51,047.7 | 52,162.6 | 52,215.8 | 54,576.1 | 53,329.1 | 52,120.3 |
| 2018 | 48,853.5 | 52,048.5 | 54,280.5 | 53,318.3 | 53,516.5 | 54,209.9 | 52,198.9 | 51,373.6 | 49,152.7 | 50,557.9 | 50,212.6 | 49,294.0 |
| 2019 | 45,238.5 | 46,571.6 | 47,580.4 | 49,731.4 | 50,360.8 | 49,325.5 | 49,763.9 | 49,835.9 | 47,451.5 | 47,546.9 | 47,045.7 | 47,717.6 |
| 2020 | 45,682.7 | 46,069.5 | 42,764.6 | 31,660.4 | 39,716.8 | 43,424.2 | 43,156.5 | 43,601.2 | 43,585.5 | 43,381.6 | 41,795.5 | 42,052.6 |
| 2021 | 40,051.8 | 38,386.0 | 44,832.4 | 46,419.8 | 45,589.8 | 46,377.6 | 45,669.9 | 45,082.9 | 44,740.7 | 45,173.6 | 45,230.8 | 44,489.5 |
| 2022 | 40,391.1 | 43,378.6 | 44,836.4 | |||||||||
| - = No Data Reported; -- = Not Applicable; NA = Not Available; W = Withheld to avoid disclosure of individual company data. |
| Release Date: 5/19/2022 |
| Next Release Date: TBD |