|
Download Data (XLS File) |
|
||||||||
|
||||||||
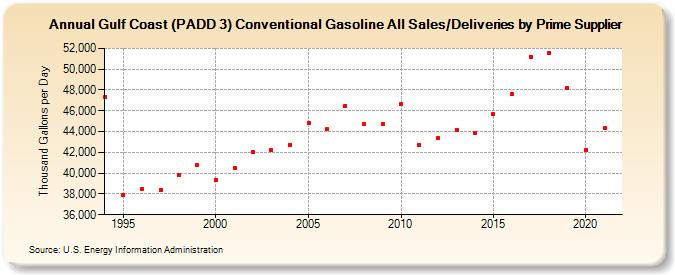
| Gulf Coast (PADD 3) Conventional Gasoline All Sales/Deliveries by Prime Supplier (Thousand Gallons per Day) | ||||||||
| Decade | Year-0 | Year-1 | Year-2 | Year-3 | Year-4 | Year-5 | Year-6 | Year-7 | Year-8 | Year-9 |
|---|---|---|---|---|---|---|---|---|---|---|
| 1990's | 47,356.6 | 37,859.0 | 38,485.7 | 38,371.1 | 39,857.7 | 40,820.3 | ||||
| 2000's | 39,317.1 | 40,525.1 | 42,033.3 | 42,218.6 | 42,739.7 | 44,792.7 | 44,199.7 | 46,502.3 | 44,774.4 | 44,694.7 |
| 2010's | 46,623.2 | 42,681.4 | 43,368.7 | 44,179.8 | 43,873.3 | 45,647.7 | 47,628.6 | 51,218.0 | 51,579.4 | 48,191.7 |
| 2020's | 42,243.2 |
| - = No Data Reported; -- = Not Applicable; NA = Not Available; W = Withheld to avoid disclosure of individual company data. |
| Release Date: 6/1/2022 |
| Next Release Date: TBD |