|
Download Data (XLS File) |
|
||||||||
|
||||||||
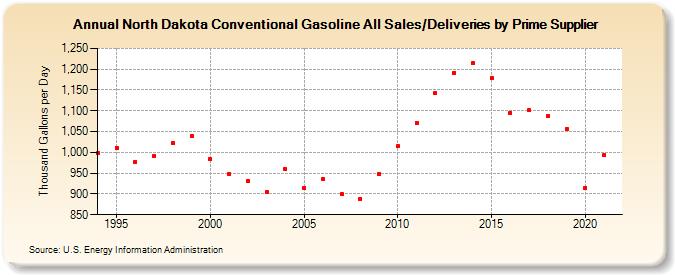
| North Dakota Conventional Gasoline All Sales/Deliveries by Prime Supplier (Thousand Gallons per Day) | ||||||||
| Decade | Year-0 | Year-1 | Year-2 | Year-3 | Year-4 | Year-5 | Year-6 | Year-7 | Year-8 | Year-9 |
|---|---|---|---|---|---|---|---|---|---|---|
| 1990's | 998.1 | 1,011.6 | 977.8 | 992.3 | 1,022.7 | 1,039.4 | ||||
| 2000's | 983.3 | 949.0 | 931.2 | 903.6 | 959.7 | 914.7 | 936.3 | 899.5 | 887.8 | 947.8 |
| 2010's | 1,014.1 | 1,071.4 | 1,142.1 | 1,191.7 | 1,214.7 | 1,179.8 | 1,095.3 | 1,101.1 | 1,086.5 | 1,056.3 |
| 2020's | 915.0 |
| - = No Data Reported; -- = Not Applicable; NA = Not Available; W = Withheld to avoid disclosure of individual company data. |
| Release Date: 6/1/2022 |
| Next Release Date: TBD |