|
Download Data (XLS File) |
|
||||||||
|
||||||||
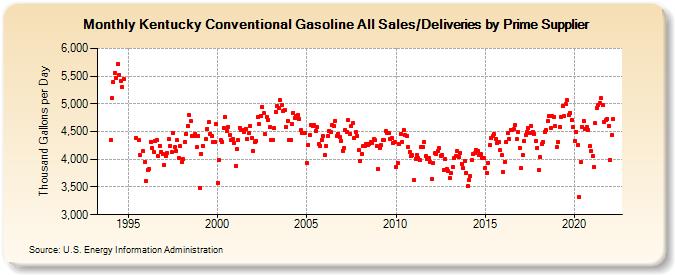
| Kentucky Conventional Gasoline All Sales/Deliveries by Prime Supplier (Thousand Gallons per Day) | ||||||||
| Year | Jan | Feb | Mar | Apr | May | Jun | Jul | Aug | Sep | Oct | Nov | Dec |
|---|---|---|---|---|---|---|---|---|---|---|---|---|
| 1993 | NA | NA | NA | |||||||||
| 1994 | 4,342.5 | 5,098.3 | 5,396.7 | 5,557.8 | 5,465.0 | 5,723.0 | 5,524.4 | 5,412.5 | 5,302.6 | 5,443.8 | W | W |
| 1995 | W | W | W | W | W | 4,389.6 | W | 4,347.6 | 4,073.9 | W | 4,144.5 | 3,954.5 |
| 1996 | 3,602.2 | 3,805.8 | 3,830.9 | 4,315.4 | 4,210.6 | 4,140.1 | 4,331.4 | 4,351.2 | 4,054.7 | 4,244.0 | 4,133.8 | 4,090.7 |
| 1997 | 3,898.2 | 4,051.5 | 4,111.4 | 4,357.0 | 4,240.8 | 4,125.2 | 4,474.0 | 4,219.7 | 4,156.5 | 4,340.8 | 4,030.4 | 4,231.6 |
| 1998 | 3,954.0 | 3,997.5 | 4,316.4 | 4,463.9 | 4,604.9 | 4,801.9 | 4,685.5 | 4,425.3 | 4,422.4 | 4,453.0 | 4,212.8 | 4,423.4 |
| 1999 | 3,490.5 | 4,103.0 | 4,248.4 | W | 4,361.5 | 4,554.6 | 4,663.6 | 4,457.7 | 4,427.4 | 4,307.5 | 4,319.0 | 4,637.7 |
| 2000 | 3,577.8 | 3,984.7 | 4,346.2 | 4,312.7 | 4,570.6 | 4,758.4 | 4,511.0 | 4,586.2 | 4,434.3 | 4,342.0 | 4,366.9 | 4,289.5 |
| 2001 | 3,885.2 | 4,180.3 | 4,343.6 | 4,568.8 | 4,523.3 | 4,525.8 | 4,486.1 | 4,553.3 | 4,366.2 | 4,477.1 | 4,599.8 | 4,384.9 |
| 2002 | 4,147.6 | 4,303.2 | 4,330.2 | 4,753.8 | 4,644.3 | 4,781.6 | 4,945.9 | 4,827.0 | 4,459.3 | 4,758.5 | 4,712.5 | 4,580.5 |
| 2003 | 4,341.9 | 4,355.0 | 4,561.5 | 4,860.7 | 4,966.7 | 4,922.1 | 5,067.0 | 4,987.6 | 4,865.1 | 4,888.0 | 4,580.7 | 4,694.0 |
| 2004 | 4,344.5 | 4,350.5 | 4,637.1 | 4,843.6 | 4,740.0 | 4,780.2 | 4,797.6 | 4,727.0 | 4,520.6 | 4,474.7 | 4,471.1 | 4,481.7 |
| 2005 | 3,929.2 | 4,263.8 | 4,435.9 | 4,609.4 | 4,604.5 | 4,615.4 | 4,514.7 | 4,577.4 | 4,273.1 | 4,243.9 | 4,352.4 | 4,419.5 |
| 2006 | 4,075.9 | 4,243.3 | 4,414.6 | 4,513.7 | 4,492.5 | 4,617.3 | 4,607.6 | 4,699.3 | 4,415.6 | 4,461.8 | 4,407.6 | 4,335.4 |
| 2007 | 4,154.5 | 4,201.0 | 4,528.6 | 4,493.2 | 4,700.7 | 4,455.2 | 4,593.9 | 4,659.8 | 4,386.3 | 4,490.5 | 4,426.4 | 4,158.3 |
| 2008 | 3,962.4 | 4,093.4 | 4,236.2 | 4,236.1 | 4,273.4 | 4,262.1 | 4,283.4 | 4,305.4 | 4,286.9 | 4,364.7 | 4,339.1 | 4,235.5 |
| 2009 | 3,821.9 | 4,204.5 | 4,248.6 | 4,349.4 | 4,343.9 | 4,505.4 | 4,479.6 | 4,468.8 | 4,373.0 | 4,383.3 | 4,289.1 | 4,309.6 |
| 2010 | 3,861.6 | 3,940.0 | 4,274.2 | 4,459.3 | 4,318.5 | 4,526.9 | 4,437.8 | 4,416.2 | 4,227.4 | 4,139.7 | 4,050.2 | 4,071.6 |
| 2011 | 3,620.9 | 4,010.3 | 4,084.3 | 4,023.4 | 3,983.5 | 4,225.3 | 4,229.3 | 4,319.5 | 4,055.7 | 4,003.6 | 4,021.2 | 3,946.1 |
| 2012 | 3,635.7 | 3,934.3 | 4,104.3 | 4,102.6 | 4,146.1 | 4,195.8 | 4,064.1 | 4,074.3 | 3,814.9 | 4,001.0 | 3,822.1 | 3,785.0 |
| 2013 | 3,660.4 | 3,746.1 | 3,862.3 | 4,016.5 | 4,057.8 | 4,143.3 | 4,043.0 | 4,116.7 | 3,920.3 | 3,838.6 | 3,965.1 | 3,752.8 |
| 2014 | 3,509.2 | 3,627.1 | 3,691.8 | 3,985.6 | 4,096.2 | 4,106.4 | 4,175.6 | 4,152.7 | 4,074.7 | 4,087.9 | 4,020.7 | 4,027.8 |
| 2015 | 3,846.5 | 3,755.0 | 3,939.3 | 4,264.3 | 4,382.0 | 4,412.4 | 4,450.8 | 4,373.1 | 4,301.1 | 4,313.3 | 4,167.2 | 4,069.5 |
| 2016 | 3,768.6 | 3,957.5 | 4,304.0 | 4,465.4 | 4,369.1 | 4,530.8 | 4,528.0 | 4,540.6 | 4,611.4 | 4,363.5 | 4,488.2 | 4,206.2 |
| 2017 | 3,840.8 | 4,078.9 | 4,331.4 | 4,445.9 | 4,499.8 | 4,570.9 | 4,469.7 | 4,605.2 | 4,488.4 | 4,463.0 | 4,335.7 | 4,209.8 |
| 2018 | 3,808.5 | 4,039.7 | 4,279.7 | 4,313.1 | 4,499.2 | 4,523.6 | 4,688.1 | 4,773.4 | 4,565.8 | 4,774.5 | 4,771.2 | 4,591.4 |
| 2019 | 4,220.8 | 4,309.9 | 4,588.3 | 4,769.0 | 4,963.5 | 4,777.3 | 4,992.5 | 5,064.4 | 4,794.1 | 4,835.9 | 4,716.3 | 4,580.6 |
| 2020 | 4,325.1 | 4,484.6 | 4,250.3 | 3,315.3 | 3,944.5 | 4,586.4 | 4,698.4 | 4,538.1 | 4,583.8 | 4,528.5 | 4,234.7 | 4,152.1 |
| 2021 | 4,053.1 | 3,863.6 | 4,648.7 | 4,923.5 | 4,972.7 | 5,007.0 | 5,099.8 | 4,970.1 | 4,674.1 | 4,699.8 | 4,725.0 | 4,608.2 |
| 2022 | 3,987.3 | 4,437.4 | 4,726.3 | |||||||||
| - = No Data Reported; -- = Not Applicable; NA = Not Available; W = Withheld to avoid disclosure of individual company data. |
| Release Date: 5/19/2022 |
| Next Release Date: TBD |