|
Download Data (XLS File) |
|
||||||||
|
||||||||
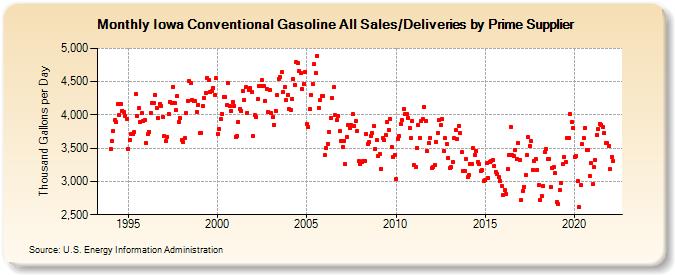
| Iowa Conventional Gasoline All Sales/Deliveries by Prime Supplier (Thousand Gallons per Day) | ||||||||
| Year | Jan | Feb | Mar | Apr | May | Jun | Jul | Aug | Sep | Oct | Nov | Dec |
|---|---|---|---|---|---|---|---|---|---|---|---|---|
| 1993 | NA | NA | NA | |||||||||
| 1994 | 3,484.0 | 3,608.9 | 3,762.2 | 3,922.0 | 3,887.1 | 4,158.9 | 4,005.8 | 4,167.2 | 4,065.5 | 4,039.4 | 3,990.7 | 3,943.4 |
| 1995 | 3,486.8 | 3,629.5 | 3,715.3 | 3,717.7 | 3,743.2 | 4,311.2 | 3,983.7 | 4,103.2 | 3,890.2 | 4,023.1 | 3,904.8 | 3,930.0 |
| 1996 | 3,578.4 | 3,706.5 | 3,748.2 | 4,036.3 | 4,178.9 | 4,173.8 | 4,300.8 | 4,109.2 | 3,953.0 | 4,171.5 | 4,136.6 | 3,963.1 |
| 1997 | 3,686.3 | 3,608.8 | 3,674.4 | 4,018.2 | 4,198.3 | 4,178.3 | 4,426.2 | 4,182.5 | 4,076.0 | 4,278.1 | 3,893.9 | 3,947.5 |
| 1998 | 3,624.2 | 3,590.8 | 3,649.2 | 4,027.6 | 4,212.0 | 4,503.1 | 4,476.0 | 4,229.5 | 4,212.0 | 4,205.5 | 4,043.0 | 4,155.1 |
| 1999 | 3,721.1 | 3,734.8 | 4,136.9 | 4,253.8 | 4,335.1 | 4,557.8 | 4,522.8 | 4,342.8 | 4,365.1 | 4,409.9 | 4,295.3 | 4,548.6 |
| 2000 | 3,712.3 | 3,790.6 | 3,934.1 | 4,019.8 | 4,275.3 | 4,269.6 | 4,148.0 | 4,472.7 | 4,132.4 | 4,056.1 | 4,192.5 | 4,139.6 |
| 2001 | 3,673.2 | 3,683.8 | 3,899.7 | 4,091.6 | 4,060.3 | 4,365.1 | 4,230.9 | 4,413.8 | 4,032.6 | 4,367.8 | 4,400.9 | 4,341.7 |
| 2002 | 3,681.5 | 3,992.8 | 3,965.9 | 4,241.2 | 4,432.5 | 4,436.3 | 4,519.4 | 4,427.7 | 4,211.1 | 4,393.2 | 4,047.7 | 4,380.0 |
| 2003 | 4,030.5 | 3,961.9 | 3,853.9 | 4,061.6 | 4,292.3 | 4,541.2 | 4,569.7 | 4,642.7 | 4,342.2 | 4,417.1 | 4,229.1 | 4,297.8 |
| 2004 | 4,086.7 | 4,080.2 | 4,243.0 | 4,538.3 | 4,456.4 | 4,791.5 | 4,774.3 | 4,657.4 | 4,629.4 | 4,387.6 | 4,461.2 | 4,651.9 |
| 2005 | 3,859.5 | 3,817.1 | 4,085.5 | 4,301.1 | 4,468.4 | 4,764.9 | 4,630.6 | 4,892.8 | 4,104.4 | 4,229.1 | 4,287.6 | 4,285.8 |
| 2006 | 3,396.4 | 3,498.4 | 3,565.7 | 3,748.8 | 3,953.3 | 4,254.4 | 4,414.7 | 3,992.2 | 3,917.4 | 3,986.7 | 3,757.7 | 3,606.7 |
| 2007 | 3,514.0 | 3,614.3 | 3,255.4 | 3,668.5 | 3,847.2 | 3,810.7 | 3,846.6 | 4,007.1 | 3,832.3 | 3,906.1 | 3,761.9 | 3,300.3 |
| 2008 | 3,257.1 | 3,299.5 | 3,307.7 | 3,307.5 | 3,711.6 | 3,566.1 | 3,586.3 | 3,688.7 | 3,726.0 | 3,840.1 | 3,488.9 | 3,626.5 |
| 2009 | 3,382.9 | 3,408.5 | 3,193.4 | 3,648.8 | 3,622.6 | 3,702.7 | 3,895.2 | 3,772.7 | 3,936.5 | 3,513.4 | 3,368.2 | 3,403.5 |
| 2010 | 3,038.8 | 3,642.3 | 3,682.7 | 3,856.2 | 3,922.1 | 4,090.2 | 4,016.7 | 4,006.9 | 3,960.6 | 3,808.0 | 3,655.5 | 3,901.6 |
| 2011 | 3,243.4 | 3,212.8 | 3,507.8 | 3,847.9 | 3,653.5 | 3,914.1 | 3,931.6 | 4,118.6 | 3,911.0 | 3,450.2 | 3,572.4 | 3,658.0 |
| 2012 | 3,205.6 | 3,219.8 | 3,247.2 | 3,589.8 | 3,729.0 | 3,921.8 | 3,844.8 | 3,937.2 | 3,461.2 | 3,648.2 | 3,566.0 | 3,358.6 |
| 2013 | 3,200.6 | 3,213.2 | 3,294.9 | 3,646.9 | 3,772.6 | 3,643.9 | 3,837.2 | 3,724.1 | 3,438.1 | 3,156.6 | 3,162.2 | 3,337.7 |
| 2014 | 3,068.9 | 3,100.7 | 3,265.7 | 3,267.4 | 3,499.5 | 3,403.5 | 3,458.3 | 3,297.2 | 3,256.7 | 3,158.8 | 3,166.5 | 3,011.3 |
| 2015 | 3,018.6 | 3,276.5 | 3,057.0 | 3,299.6 | 3,312.7 | 3,319.8 | 3,232.7 | 3,148.0 | 3,104.5 | 3,064.4 | 3,004.0 | 2,932.8 |
| 2016 | 2,791.1 | 2,870.0 | 2,817.8 | 3,189.8 | 3,391.4 | 3,824.0 | 3,398.5 | 3,380.5 | 3,474.1 | 3,330.6 | 3,579.0 | 3,327.8 |
| 2017 | 2,722.5 | 2,854.8 | 2,923.6 | 3,099.6 | 3,391.7 | 3,667.9 | 3,532.5 | 3,603.1 | 3,173.0 | 3,314.5 | 3,335.2 | 3,177.6 |
| 2018 | 2,942.3 | 2,726.7 | 2,783.8 | 2,932.8 | 3,439.1 | 3,484.7 | 3,332.6 | 3,339.3 | 2,918.3 | 3,199.8 | 3,210.9 | 3,121.7 |
| 2019 | 2,691.1 | 2,658.6 | 2,876.3 | 2,978.1 | 3,255.1 | 3,369.4 | 3,294.1 | 3,650.2 | 3,658.4 | 4,015.1 | 3,892.1 | 3,801.3 |
| 2020 | 3,374.7 | 3,388.8 | 3,004.7 | 2,609.2 | 2,944.7 | 3,558.6 | 3,654.2 | 3,808.7 | 3,478.2 | 3,471.6 | 3,084.8 | 3,271.1 |
| 2021 | 2,957.7 | 3,211.8 | 3,325.9 | 3,699.1 | 3,785.7 | 3,870.8 | 3,850.1 | 3,814.6 | 3,725.3 | 3,571.1 | 3,575.6 | 3,539.2 |
| 2022 | 3,183.3 | 3,368.4 | 3,305.6 | |||||||||
| - = No Data Reported; -- = Not Applicable; NA = Not Available; W = Withheld to avoid disclosure of individual company data. |
| Release Date: 5/19/2022 |
| Next Release Date: TBD |