|
Download Data (XLS File) |
|
||||||||
|
||||||||
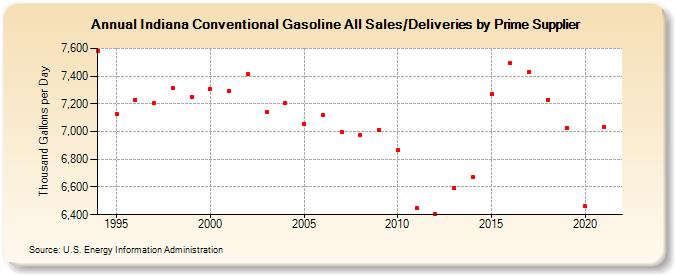
| Indiana Conventional Gasoline All Sales/Deliveries by Prime Supplier (Thousand Gallons per Day) | ||||||||
| Decade | Year-0 | Year-1 | Year-2 | Year-3 | Year-4 | Year-5 | Year-6 | Year-7 | Year-8 | Year-9 |
|---|---|---|---|---|---|---|---|---|---|---|
| 1990's | 7,582.5 | 7,127.9 | 7,227.6 | 7,203.8 | 7,313.8 | 7,251.8 | ||||
| 2000's | 7,304.9 | 7,293.0 | 7,417.2 | 7,142.8 | 7,209.0 | 7,055.4 | 7,120.3 | 6,995.5 | 6,976.2 | 7,008.4 |
| 2010's | 6,864.6 | 6,445.6 | 6,404.2 | 6,590.0 | 6,669.5 | 7,268.2 | 7,491.5 | 7,432.4 | 7,230.3 | 7,027.7 |
| 2020's | 6,461.8 |
| - = No Data Reported; -- = Not Applicable; NA = Not Available; W = Withheld to avoid disclosure of individual company data. |
| Release Date: 6/1/2022 |
| Next Release Date: TBD |