|
Download Data (XLS File) |
|
||||||||
|
||||||||
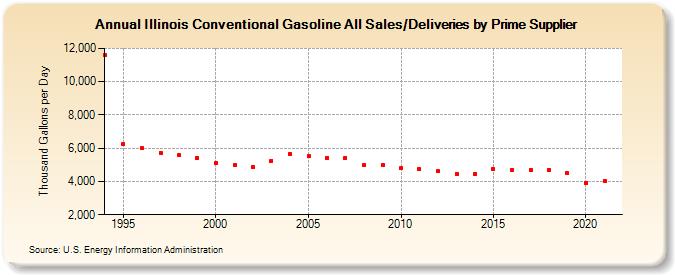
| Illinois Conventional Gasoline All Sales/Deliveries by Prime Supplier (Thousand Gallons per Day) | ||||||||
| Decade | Year-0 | Year-1 | Year-2 | Year-3 | Year-4 | Year-5 | Year-6 | Year-7 | Year-8 | Year-9 |
|---|---|---|---|---|---|---|---|---|---|---|
| 1990's | 11,631.0 | 6,224.7 | 6,010.9 | 5,724.9 | 5,579.5 | 5,429.5 | ||||
| 2000's | 5,092.7 | 4,983.4 | 4,870.6 | 5,251.7 | 5,671.3 | 5,519.4 | 5,438.8 | 5,430.4 | 4,968.4 | 4,968.2 |
| 2010's | 4,789.3 | 4,722.8 | 4,605.7 | 4,472.7 | 4,447.5 | 4,745.2 | 4,708.2 | 4,699.0 | 4,698.1 | 4,486.0 |
| 2020's | 3,926.6 |
| - = No Data Reported; -- = Not Applicable; NA = Not Available; W = Withheld to avoid disclosure of individual company data. |
| Release Date: 6/1/2022 |
| Next Release Date: TBD |