|
Download Data (XLS File) |
|
||||||||
|
||||||||
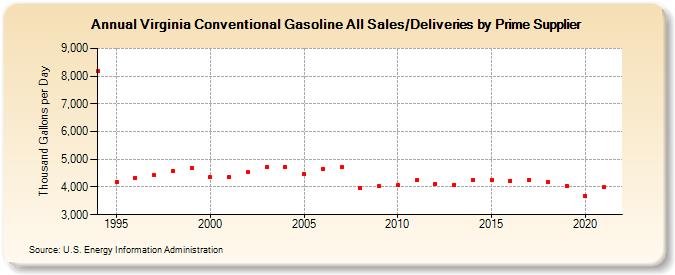
| Virginia Conventional Gasoline All Sales/Deliveries by Prime Supplier (Thousand Gallons per Day) | ||||||||
| Decade | Year-0 | Year-1 | Year-2 | Year-3 | Year-4 | Year-5 | Year-6 | Year-7 | Year-8 | Year-9 |
|---|---|---|---|---|---|---|---|---|---|---|
| 1990's | 8,190.1 | 4,182.8 | 4,341.3 | 4,416.0 | 4,593.6 | 4,689.9 | ||||
| 2000's | 4,348.9 | 4,369.1 | 4,526.6 | 4,712.2 | 4,717.7 | 4,472.5 | 4,665.7 | 4,715.7 | 3,960.9 | 4,021.6 |
| 2010's | 4,061.1 | 4,235.2 | 4,112.6 | 4,085.8 | 4,244.9 | 4,254.8 | 4,227.3 | 4,264.6 | 4,173.5 | 4,035.9 |
| 2020's | 3,674.1 |
| - = No Data Reported; -- = Not Applicable; NA = Not Available; W = Withheld to avoid disclosure of individual company data. |
| Release Date: 6/1/2022 |
| Next Release Date: TBD |