|
Download Data (XLS File) |
|
||||||||
|
||||||||
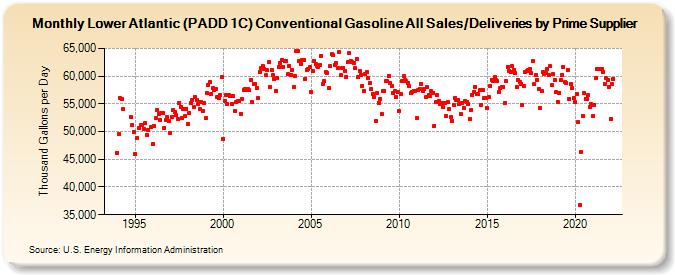
| Lower Atlantic (PADD 1C) Conventional Gasoline All Sales/Deliveries by Prime Supplier (Thousand Gallons per Day) | ||||||||
| Year | Jan | Feb | Mar | Apr | May | Jun | Jul | Aug | Sep | Oct | Nov | Dec |
|---|---|---|---|---|---|---|---|---|---|---|---|---|
| 1993 | NA | NA | NA | |||||||||
| 1994 | 46,207.7 | 49,559.8 | 56,024.4 | 55,863.5 | 53,994.9 | W | W | W | W | 52,572.5 | 51,145.9 | 49,944.6 |
| 1995 | 45,908.3 | 48,785.1 | W | 50,625.4 | 51,192.8 | 51,233.1 | 50,544.7 | 51,581.3 | 49,319.1 | 50,351.5 | W | 50,829.8 |
| 1996 | 47,731.6 | 50,943.2 | 52,479.7 | 53,893.8 | 53,239.7 | 52,091.0 | 53,285.8 | 53,306.7 | 50,638.9 | 52,125.8 | 52,608.3 | 51,907.1 |
| 1997 | 49,762.3 | 52,675.2 | 53,802.2 | 53,567.6 | 52,904.9 | 52,347.0 | 55,211.6 | 54,516.2 | 52,429.6 | 54,149.2 | 52,732.1 | 54,155.7 |
| 1998 | 51,426.8 | 53,414.9 | 55,074.8 | 55,729.9 | 54,403.5 | 56,271.3 | 55,685.7 | 55,024.0 | 54,029.6 | 55,387.9 | 53,698.0 | 55,213.6 |
| 1999 | 52,439.7 | 56,884.2 | 58,470.4 | 58,995.0 | 56,740.8 | 57,792.2 | 57,473.2 | 57,683.4 | 56,234.7 | 56,128.2 | 56,609.3 | 59,896.8 |
| 2000 | 48,702.7 | 55,590.4 | 56,525.7 | 54,886.0 | 56,591.2 | 56,461.0 | 55,035.1 | 56,343.5 | 53,709.1 | 55,330.3 | 55,420.7 | 55,466.9 |
| 2001 | 53,215.7 | 55,926.2 | 57,468.3 | 57,658.1 | 57,488.7 | 57,661.0 | 57,428.6 | 59,333.1 | 55,279.2 | 58,622.8 | 58,563.0 | 57,879.2 |
| 2002 | 56,083.5 | 60,721.4 | 61,520.5 | 61,788.2 | 61,222.2 | 60,151.3 | 61,068.7 | 62,468.8 | 58,106.6 | 61,141.0 | 60,142.9 | 59,524.9 |
| 2003 | 57,337.6 | 59,642.4 | 61,578.9 | 62,381.4 | 62,984.4 | 61,679.2 | 62,775.3 | 62,792.6 | 60,325.7 | 61,879.8 | 60,185.8 | 61,090.6 |
| 2004 | 58,035.2 | 60,023.0 | 64,445.0 | 64,454.3 | 62,766.0 | 62,164.2 | 62,859.6 | 62,981.6 | 59,552.0 | 61,101.5 | 61,301.4 | 61,683.5 |
| 2005 | 57,055.8 | 60,942.5 | 62,771.9 | 62,143.6 | 61,782.7 | 61,672.4 | 61,981.7 | 63,688.0 | 58,608.6 | 59,044.5 | 60,716.9 | 60,584.5 |
| 2006 | 57,772.2 | 61,795.7 | 63,906.6 | 63,748.2 | 61,960.4 | 62,294.4 | 61,373.2 | 64,369.9 | 60,150.7 | 61,407.3 | 61,470.3 | 60,980.3 |
| 2007 | 59,912.3 | 62,499.1 | 64,111.7 | 62,803.3 | 62,530.0 | 62,327.5 | 61,404.6 | 63,155.3 | 59,877.1 | 60,904.8 | 60,212.7 | 58,283.1 |
| 2008 | 57,363.7 | 60,377.3 | 60,714.2 | 59,603.8 | 58,680.6 | 57,595.3 | 56,730.3 | 56,280.0 | 51,915.3 | 56,884.4 | 55,200.9 | 55,911.8 |
| 2009 | 53,158.7 | 57,308.3 | 57,398.5 | 59,123.4 | 59,055.7 | 60,093.6 | 58,740.7 | 58,262.0 | 56,977.4 | 57,342.2 | 56,173.5 | 57,082.9 |
| 2010 | 53,694.6 | 56,755.8 | 59,136.0 | 59,953.2 | 59,335.6 | 59,038.8 | 58,767.1 | 58,157.4 | 56,903.1 | 57,158.6 | 57,321.5 | 57,282.2 |
| 2011 | 52,475.5 | 57,436.6 | 57,706.0 | 58,645.0 | 57,245.7 | 57,671.9 | 56,172.4 | 57,986.2 | 56,526.6 | 56,409.5 | 57,244.5 | 57,007.0 |
| 2012 | 51,061.0 | 55,416.0 | 56,548.5 | 55,567.8 | 55,056.8 | 55,093.7 | 54,364.7 | 55,142.4 | 52,724.1 | 55,264.6 | 54,072.8 | 52,615.2 |
| 2013 | 51,873.3 | 54,796.6 | 56,124.6 | 55,777.4 | 55,774.2 | 54,904.6 | 53,117.1 | 55,212.6 | 54,253.1 | 55,509.4 | 55,295.2 | 54,887.6 |
| 2014 | 52,296.3 | 53,887.9 | 56,606.5 | 57,123.0 | 58,038.2 | 56,842.5 | 56,699.3 | 57,501.1 | 54,794.7 | 57,430.2 | 56,075.1 | 56,063.7 |
| 2015 | 54,174.9 | 56,302.4 | 58,199.7 | 59,367.4 | 59,109.5 | 59,798.8 | 59,372.6 | 59,124.8 | 57,206.1 | 57,882.5 | 58,123.5 | 58,065.1 |
| 2016 | 55,145.5 | 59,173.5 | 61,695.0 | 60,983.1 | 60,668.4 | 61,736.5 | 61,179.3 | 60,485.5 | 57,999.9 | 59,254.9 | 58,937.1 | 58,598.8 |
| 2017 | 54,740.1 | 58,186.8 | 60,810.9 | 60,996.1 | 61,063.6 | 61,240.3 | 60,504.5 | 62,651.0 | 58,498.8 | 60,197.0 | 59,388.3 | 57,694.6 |
| 2018 | 54,310.4 | 57,301.9 | 60,665.2 | 60,463.3 | 60,606.1 | 61,336.1 | 60,150.8 | 61,762.4 | 58,446.6 | 60,439.2 | 59,286.9 | 57,114.0 |
| 2019 | 55,390.9 | 56,980.5 | 59,253.1 | 60,186.7 | 61,709.7 | 58,906.4 | 58,777.6 | 61,037.7 | 55,898.5 | 58,556.6 | 57,798.1 | 56,090.4 |
| 2020 | 55,244.2 | 56,777.6 | 51,634.8 | 36,708.6 | 46,381.0 | 52,789.8 | 56,910.6 | 55,940.1 | 55,816.7 | 56,524.4 | 54,491.5 | 54,922.1 |
| 2021 | 52,891.2 | 54,848.9 | 59,728.6 | 61,250.0 | 61,225.8 | 61,236.9 | 61,275.0 | 60,811.8 | 58,664.1 | 59,612.1 | 59,325.7 | 58,059.5 |
| 2022 | 52,345.9 | 58,541.1 | 59,551.8 | |||||||||
| - = No Data Reported; -- = Not Applicable; NA = Not Available; W = Withheld to avoid disclosure of individual company data. |
| Release Date: 5/19/2022 |
| Next Release Date: TBD |