|
Download Data (XLS File) |
|
||||||||
|
||||||||
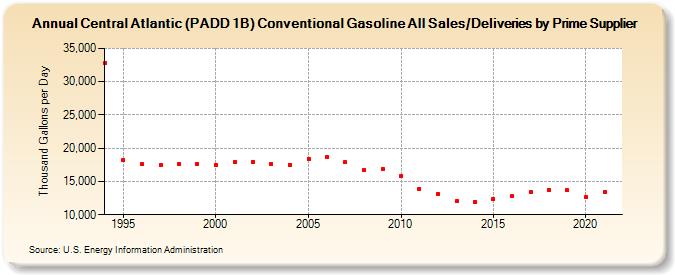
| Central Atlantic (PADD 1B) Conventional Gasoline All Sales/Deliveries by Prime Supplier (Thousand Gallons per Day) | ||||||||
| Decade | Year-0 | Year-1 | Year-2 | Year-3 | Year-4 | Year-5 | Year-6 | Year-7 | Year-8 | Year-9 |
|---|---|---|---|---|---|---|---|---|---|---|
| 1990's | 32,739.4 | 18,170.2 | 17,602.5 | 17,469.0 | 17,674.0 | 17,688.9 | ||||
| 2000's | 17,492.7 | 17,911.5 | 17,979.0 | 17,619.7 | 17,523.3 | 18,440.4 | 18,653.8 | 17,882.3 | 16,694.7 | 16,907.8 |
| 2010's | 15,831.4 | 13,902.8 | 13,183.4 | 12,031.2 | 11,957.4 | 12,393.5 | 12,750.7 | 13,389.3 | 13,749.2 | 13,667.4 |
| 2020's | 12,650.5 |
| - = No Data Reported; -- = Not Applicable; NA = Not Available; W = Withheld to avoid disclosure of individual company data. |
| Release Date: 6/1/2022 |
| Next Release Date: TBD |