|
Download Data (XLS File) |
|
||||||||
|
||||||||
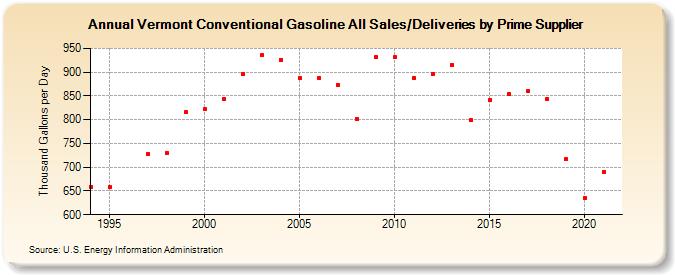
| Vermont Conventional Gasoline All Sales/Deliveries by Prime Supplier (Thousand Gallons per Day) | ||||||||
| Decade | Year-0 | Year-1 | Year-2 | Year-3 | Year-4 | Year-5 | Year-6 | Year-7 | Year-8 | Year-9 |
|---|---|---|---|---|---|---|---|---|---|---|
| 1990's | 659.3 | 657.4 | W | 728.1 | 730.3 | 815.9 | ||||
| 2000's | 822.5 | 843.2 | 895.8 | 935.3 | 926.1 | 888.4 | 888.3 | 873.2 | 802.4 | 930.9 |
| 2010's | 931.0 | 887.9 | 896.0 | 915.9 | 798.3 | 842.1 | 853.5 | 860.1 | 844.5 | 716.2 |
| 2020's | 635.7 |
| - = No Data Reported; -- = Not Applicable; NA = Not Available; W = Withheld to avoid disclosure of individual company data. |
| Release Date: 6/1/2022 |
| Next Release Date: TBD |