|
Download Data (XLS File) |
|
||||||||
|
||||||||
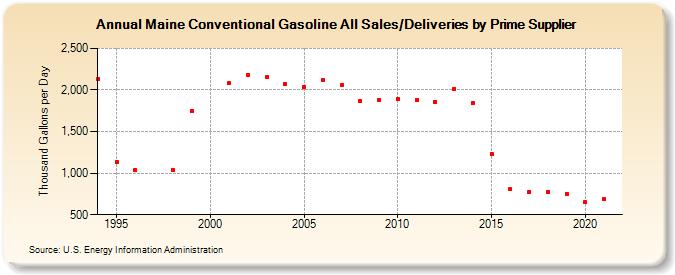
| Maine Conventional Gasoline All Sales/Deliveries by Prime Supplier (Thousand Gallons per Day) | ||||||||
| Decade | Year-0 | Year-1 | Year-2 | Year-3 | Year-4 | Year-5 | Year-6 | Year-7 | Year-8 | Year-9 |
|---|---|---|---|---|---|---|---|---|---|---|
| 1990's | 2,131.2 | 1,135.9 | 1,036.0 | W | 1,041.7 | 1,748.3 | ||||
| 2000's | W | 2,079.1 | 2,182.8 | 2,150.1 | 2,074.1 | 2,040.5 | 2,122.7 | 2,060.3 | 1,866.8 | 1,878.1 |
| 2010's | 1,888.9 | 1,881.7 | 1,852.8 | 2,015.0 | 1,841.3 | 1,234.0 | 804.1 | 778.8 | 777.9 | 752.3 |
| 2020's | 648.8 |
| - = No Data Reported; -- = Not Applicable; NA = Not Available; W = Withheld to avoid disclosure of individual company data. |
| Release Date: 6/1/2022 |
| Next Release Date: TBD |