|
Download Data (XLS File) |
|
||||||||
|
||||||||
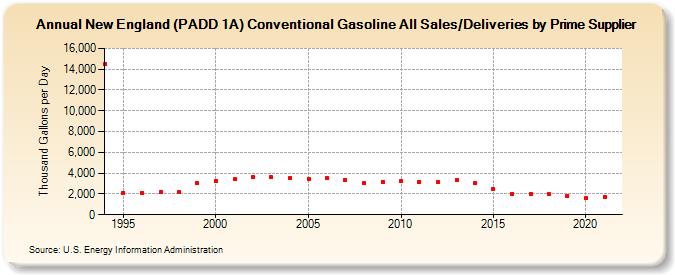
| New England (PADD 1A) Conventional Gasoline All Sales/Deliveries by Prime Supplier (Thousand Gallons per Day) | ||||||||
| Decade | Year-0 | Year-1 | Year-2 | Year-3 | Year-4 | Year-5 | Year-6 | Year-7 | Year-8 | Year-9 |
|---|---|---|---|---|---|---|---|---|---|---|
| 1990's | 14,481.3 | 2,124.5 | 2,121.2 | 2,165.1 | 2,180.5 | 3,011.9 | ||||
| 2000's | 3,283.2 | 3,411.9 | 3,585.5 | 3,603.4 | 3,508.8 | 3,427.5 | 3,520.9 | 3,345.7 | 3,022.9 | 3,193.6 |
| 2010's | 3,205.6 | 3,146.9 | 3,142.7 | 3,330.4 | 3,012.1 | 2,465.9 | 2,014.4 | 2,014.7 | 1,966.8 | 1,816.0 |
| 2020's | 1,581.4 |
| - = No Data Reported; -- = Not Applicable; NA = Not Available; W = Withheld to avoid disclosure of individual company data. |
| Release Date: 6/1/2022 |
| Next Release Date: TBD |