|
Download Data (XLS File) |
|
||||||||
|
||||||||
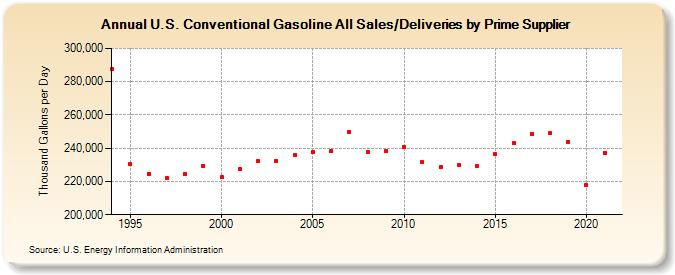
| U.S. Conventional Gasoline All Sales/Deliveries by Prime Supplier (Thousand Gallons per Day) | ||||||||
| Decade | Year-0 | Year-1 | Year-2 | Year-3 | Year-4 | Year-5 | Year-6 | Year-7 | Year-8 | Year-9 |
|---|---|---|---|---|---|---|---|---|---|---|
| 1990's | 287,629.1 | 230,345.4 | 224,626.1 | 222,318.6 | 224,444.2 | 229,564.7 | ||||
| 2000's | 222,438.1 | 227,337.7 | 232,131.4 | 232,509.0 | 236,000.8 | 237,647.8 | 238,488.9 | 249,858.2 | 237,672.5 | 238,394.3 |
| 2010's | 240,548.2 | 231,630.7 | 228,546.6 | 229,800.7 | 229,078.5 | 236,322.3 | 243,092.2 | 248,665.6 | 248,892.7 | 243,768.4 |
| 2020's | 217,744.1 |
| - = No Data Reported; -- = Not Applicable; NA = Not Available; W = Withheld to avoid disclosure of individual company data. |
| Release Date: 6/1/2022 |
| Next Release Date: TBD |