|
Download Data (XLS File) |
|
||||||||
|
||||||||
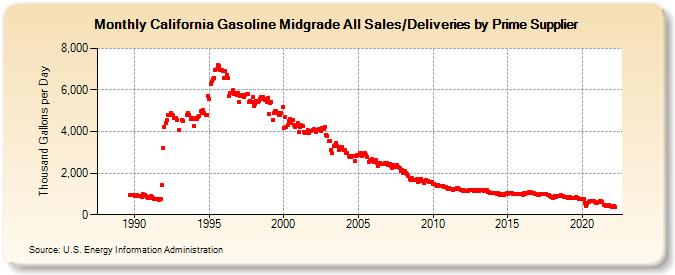
| California Gasoline Midgrade All Sales/Deliveries by Prime Supplier (Thousand Gallons per Day) | ||||||||
| Year | Jan | Feb | Mar | Apr | May | Jun | Jul | Aug | Sep | Oct | Nov | Dec |
|---|---|---|---|---|---|---|---|---|---|---|---|---|
| 1988 | NA | NA | NA | NA | NA | NA | NA | NA | NA | NA | NA | NA |
| 1989 | W | W | W | W | W | W | W | W | 964.7 | 962.0 | 951.5 | 957.7 |
| 1990 | 878.8 | 910.0 | 928.3 | 922.8 | 915.0 | 913.2 | 873.4 | 982.0 | 928.3 | 918.2 | 846.2 | 797.6 |
| 1991 | 786.7 | 896.5 | 848.3 | 799.2 | 766.2 | 777.6 | 765.2 | 763.3 | 701.7 | 768.5 | 1,428.6 | 3,208.9 |
| 1992 | 4,237.9 | 4,421.9 | 4,555.2 | 4,816.9 | 4,807.5 | 4,912.6 | 4,791.1 | 4,787.3 | 4,642.8 | 4,635.8 | 4,541.6 | W |
| 1993 | 4,059.4 | W | 4,560.6 | 4,527.9 | W | W | 4,818.9 | 4,881.5 | 4,807.4 | 4,609.7 | 4,665.5 | 4,606.0 |
| 1994 | 4,267.2 | 4,631.1 | 4,627.6 | 4,697.9 | 4,735.9 | 4,971.2 | 4,884.0 | 5,021.8 | 4,890.9 | 4,787.6 | 4,788.3 | 5,702.3 |
| 1995 | 5,567.9 | 6,296.4 | 6,426.1 | 6,525.0 | 6,598.5 | 6,978.0 | 6,986.2 | 7,221.4 | 7,139.7 | 6,979.3 | 6,941.6 | 6,907.1 |
| 1996 | 6,597.7 | 6,899.8 | 6,735.6 | 6,584.1 | 5,717.9 | 5,868.2 | 5,871.3 | 5,990.8 | 5,783.9 | 5,832.8 | 5,780.4 | 5,855.9 |
| 1997 | 5,398.3 | 5,712.0 | 5,756.6 | 5,732.9 | 5,680.3 | 5,735.1 | 5,790.9 | 5,805.1 | 5,443.9 | 5,471.9 | 5,441.8 | 5,642.6 |
| 1998 | 5,223.1 | 5,331.5 | 5,478.9 | 5,426.9 | 5,454.2 | 5,565.5 | 5,641.7 | 5,679.4 | 5,560.1 | 5,526.5 | 5,443.8 | 5,631.9 |
| 1999 | 4,863.7 | 5,379.4 | 5,430.6 | 4,578.2 | 4,879.3 | 4,983.2 | 4,988.0 | 4,908.5 | 4,812.0 | 4,802.0 | 4,882.6 | 5,184.5 |
| 2000 | 4,152.9 | 4,709.7 | 4,199.9 | 4,310.1 | 4,515.0 | 4,594.9 | 4,422.7 | 4,565.5 | 4,313.1 | 4,210.0 | 4,253.9 | 4,403.8 |
| 2001 | 3,991.6 | 4,231.0 | 4,304.3 | 4,273.4 | 3,996.8 | 3,951.4 | 3,935.1 | 4,075.4 | 3,951.6 | 4,020.4 | 4,018.6 | 4,078.0 |
| 2002 | 4,109.7 | 4,098.3 | 4,000.0 | 4,074.0 | 4,109.4 | 4,114.6 | 4,011.2 | 4,186.8 | 4,130.2 | 4,204.8 | 3,848.1 | 3,792.5 |
| 2003 | 3,543.9 | 3,551.1 | 3,114.2 | 2,945.9 | 3,290.1 | 3,350.6 | 3,429.8 | 3,289.9 | 3,116.9 | 3,174.5 | 3,233.5 | 3,248.5 |
| 2004 | 3,105.7 | 3,100.2 | 2,980.8 | 2,961.1 | 2,816.4 | 2,755.1 | 2,781.3 | 2,805.8 | 2,827.1 | 2,606.0 | 2,810.1 | 2,864.2 |
| 2005 | 2,873.0 | 2,954.3 | 2,945.8 | 2,810.0 | 2,885.2 | 2,944.7 | 2,868.5 | 2,782.1 | 2,557.3 | 2,576.9 | 2,630.8 | 2,676.8 |
| 2006 | 2,536.8 | 2,654.6 | 2,619.6 | 2,495.5 | 2,366.7 | 2,467.1 | 2,415.9 | 2,432.0 | 2,457.2 | 2,465.6 | 2,454.6 | 2,466.2 |
| 2007 | 2,406.1 | 2,425.6 | 2,366.2 | 2,257.4 | 2,373.6 | 2,322.8 | 2,299.9 | 2,378.4 | 2,298.9 | 2,232.5 | 2,107.2 | 2,137.4 |
| 2008 | 1,997.1 | 2,117.7 | 2,014.1 | 1,980.3 | 1,874.2 | 1,709.4 | 1,693.5 | 1,743.3 | 1,691.8 | 1,672.5 | 1,679.6 | 1,739.6 |
| 2009 | 1,594.6 | 1,625.6 | 1,708.4 | 1,623.8 | 1,624.4 | 1,535.8 | 1,647.1 | 1,620.1 | 1,622.3 | 1,594.4 | 1,563.4 | 1,581.0 |
| 2010 | 1,457.2 | 1,499.1 | 1,449.0 | 1,404.7 | 1,417.2 | 1,391.5 | 1,380.5 | 1,384.1 | 1,396.5 | 1,351.1 | 1,335.8 | 1,294.8 |
| 2011 | 1,259.6 | 1,303.2 | 1,223.7 | 1,218.4 | 1,198.5 | 1,236.3 | 1,250.7 | 1,275.0 | 1,263.6 | 1,260.0 | 1,192.4 | 1,210.7 |
| 2012 | 1,119.7 | 1,172.4 | 1,118.8 | 1,149.7 | 1,157.9 | 1,206.8 | 1,204.3 | 1,212.0 | 1,190.5 | 1,135.2 | 1,167.4 | 1,167.8 |
| 2013 | 1,146.7 | 1,135.4 | 1,179.3 | 1,186.6 | 1,171.7 | 1,164.2 | 1,151.8 | 1,188.4 | 1,077.9 | 1,082.5 | 1,055.1 | 1,041.9 |
| 2014 | 1,052.3 | 1,031.6 | 1,024.1 | 1,016.3 | 1,026.8 | 1,010.1 | 971.5 | 1,003.0 | 959.9 | 952.3 | 1,004.7 | 1,040.5 |
| 2015 | 991.0 | 1,031.8 | 1,036.8 | 1,045.7 | 1,005.0 | 1,017.0 | 978.2 | 1,007.1 | 1,010.0 | 996.2 | 978.0 | 1,008.6 |
| 2016 | 962.8 | 1,022.9 | 1,019.2 | 1,050.2 | 1,055.4 | 1,069.7 | 1,060.0 | 1,076.0 | 1,068.3 | 1,027.2 | 991.9 | 983.1 |
| 2017 | 932.7 | 955.6 | 989.2 | 975.5 | 998.9 | 1,002.6 | 977.1 | 991.6 | 953.9 | 958.7 | 882.5 | 871.6 |
| 2018 | 812.4 | 855.0 | 893.6 | 832.9 | 895.8 | 897.8 | 891.8 | 924.2 | 892.5 | 870.5 | 848.9 | 851.9 |
| 2019 | 789.8 | 837.6 | 834.0 | 826.4 | 800.1 | 816.6 | 811.2 | 872.2 | 816.6 | 767.9 | 742.7 | 738.1 |
| 2020 | 732.5 | 739.7 | 584.8 | 408.1 | 529.7 | 634.0 | 640.4 | 664.9 | 654.1 | 662.8 | 623.4 | 585.2 |
| 2021 | 569.2 | 617.6 | 650.1 | 677.1 | 609.3 | 463.2 | 465.7 | 437.0 | 428.6 | 455.4 | 402.1 | 396.8 |
| 2022 | 350.0 | 403.4 | 387.3 | |||||||||
| - = No Data Reported; -- = Not Applicable; NA = Not Available; W = Withheld to avoid disclosure of individual company data. |
| Release Date: 5/19/2022 |
| Next Release Date: TBD |