|
Download Data (XLS File) |
|
||||||||
|
||||||||
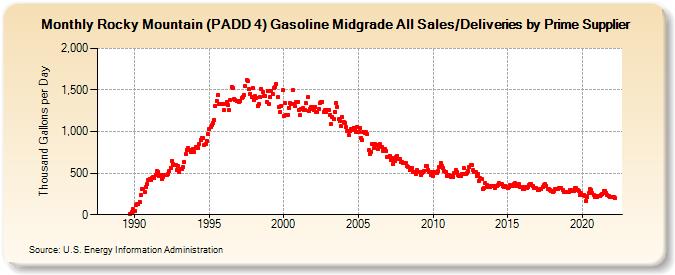
| Rocky Mountain (PADD 4) Gasoline Midgrade All Sales/Deliveries by Prime Supplier (Thousand Gallons per Day) | ||||||||
| Year | Jan | Feb | Mar | Apr | May | Jun | Jul | Aug | Sep | Oct | Nov | Dec |
|---|---|---|---|---|---|---|---|---|---|---|---|---|
| 1988 | NA | NA | NA | NA | NA | NA | NA | NA | NA | NA | NA | NA |
| 1989 | W | W | W | W | W | W | W | W | 14.3 | W | 26.9 | 68.6 |
| 1990 | 44.7 | 114.4 | 124.0 | 124.6 | 153.1 | 232.9 | 314.4 | 314.0 | 272.4 | 336.6 | 366.6 | 418.1 |
| 1991 | 432.4 | 417.8 | 441.6 | 449.6 | 447.1 | 473.1 | 520.9 | 514.5 | 465.8 | 482.1 | 433.4 | 451.0 |
| 1992 | 472.4 | 475.9 | 482.2 | 495.4 | 523.0 | 565.3 | 651.6 | 609.1 | 593.9 | 601.5 | 540.6 | 585.4 |
| 1993 | 511.2 | 544.9 | 553.7 | 572.3 | 638.0 | 725.3 | 780.2 | 807.2 | 775.2 | 760.0 | 776.8 | 795.5 |
| 1994 | 756.7 | 813.3 | 801.6 | 805.6 | 852.4 | 900.1 | 925.6 | 924.1 | 843.1 | 851.3 | 892.2 | 968.2 |
| 1995 | 1,024.9 | 1,053.3 | 1,079.0 | 1,105.4 | 1,144.0 | 1,307.4 | 1,372.0 | 1,439.2 | 1,330.9 | 1,327.5 | 1,325.7 | 1,327.2 |
| 1996 | 1,257.1 | 1,331.8 | 1,359.4 | 1,322.6 | 1,259.1 | 1,378.4 | 1,538.0 | 1,518.3 | 1,393.0 | 1,381.0 | 1,362.5 | 1,363.1 |
| 1997 | 1,350.6 | 1,372.4 | 1,404.9 | 1,420.7 | 1,436.6 | 1,543.4 | 1,617.5 | 1,603.8 | 1,508.5 | 1,452.6 | 1,415.4 | 1,528.0 |
| 1998 | 1,384.9 | 1,424.2 | 1,407.0 | 1,313.2 | 1,328.5 | 1,414.8 | 1,510.5 | 1,479.4 | 1,428.5 | 1,431.1 | 1,359.5 | 1,490.5 |
| 1999 | 1,334.8 | 1,419.6 | 1,490.2 | 1,452.1 | 1,522.2 | 1,540.1 | 1,570.1 | 1,409.6 | 1,299.8 | 1,239.6 | 1,307.8 | 1,495.3 |
| 2000 | 1,184.7 | 1,338.9 | 1,198.2 | 1,203.6 | 1,289.0 | 1,339.2 | 1,336.4 | 1,494.9 | 1,333.2 | 1,303.4 | 1,349.4 | 1,355.5 |
| 2001 | 1,258.0 | 1,194.4 | 1,270.8 | 1,279.6 | 1,257.3 | 1,258.6 | 1,337.6 | 1,414.8 | 1,251.5 | 1,276.0 | 1,292.2 | 1,300.1 |
| 2002 | 1,254.2 | 1,298.8 | 1,237.7 | 1,232.7 | 1,269.9 | 1,343.9 | 1,355.9 | 1,359.3 | 1,239.3 | 1,257.5 | 1,241.0 | 1,263.7 |
| 2003 | 1,256.9 | 1,203.0 | 1,093.3 | 1,178.6 | 1,151.0 | 1,238.6 | 1,344.8 | 1,301.0 | 1,147.3 | 1,131.2 | 1,064.9 | 1,172.1 |
| 2004 | 1,120.1 | 1,106.0 | 1,051.9 | 1,008.6 | 959.1 | 1,004.0 | 1,030.0 | 1,020.6 | 1,046.9 | 1,022.7 | 1,000.4 | 1,055.7 |
| 2005 | 998.0 | 1,036.9 | 921.2 | 897.2 | 999.1 | 988.5 | 990.9 | 972.6 | 772.9 | 734.8 | 757.4 | 846.5 |
| 2006 | 797.3 | 854.5 | 837.4 | 843.8 | 791.4 | 848.1 | 820.2 | 811.6 | 770.2 | 786.9 | 770.6 | 688.8 |
| 2007 | 690.8 | 711.2 | 652.7 | 677.1 | 609.2 | 650.8 | 689.3 | 707.7 | 669.1 | 671.6 | 632.9 | 636.1 |
| 2008 | 627.0 | 622.5 | 618.9 | 591.3 | 576.3 | 534.4 | 559.1 | 567.4 | 508.8 | 508.3 | 492.2 | 534.4 |
| 2009 | 513.8 | 519.3 | 478.1 | 498.1 | 508.1 | 530.7 | 587.3 | 582.2 | 538.3 | 513.7 | 482.9 | 515.9 |
| 2010 | 465.3 | 510.1 | 507.9 | 500.4 | 523.8 | 575.0 | 622.7 | 586.0 | 560.2 | 525.1 | 513.6 | 468.0 |
| 2011 | 465.4 | 474.3 | 451.0 | 461.3 | 458.6 | 499.0 | 532.1 | 509.2 | 482.4 | 467.7 | 462.1 | 494.9 |
| 2012 | 492.1 | 555.9 | 490.9 | 497.4 | 529.3 | 572.1 | 592.0 | 594.5 | 534.8 | 514.8 | 518.0 | 469.1 |
| 2013 | 493.7 | 409.2 | 435.6 | 431.8 | 308.5 | 318.7 | 380.4 | 357.8 | 331.4 | 342.7 | 333.9 | 347.6 |
| 2014 | 346.5 | 344.3 | 326.1 | 347.1 | 356.1 | 376.2 | 372.3 | 364.9 | 346.0 | 335.6 | 348.4 | 337.4 |
| 2015 | 317.1 | 338.9 | 356.7 | 340.2 | 348.5 | 367.1 | 377.1 | 340.0 | 345.0 | 363.9 | 328.2 | 337.2 |
| 2016 | 303.5 | 315.0 | 333.8 | 322.8 | 329.9 | 358.5 | 369.9 | 365.5 | 340.6 | 325.7 | 321.2 | 319.5 |
| 2017 | 292.0 | 297.6 | 304.7 | 314.8 | 337.5 | 359.1 | 368.8 | 350.6 | 310.6 | 303.7 | 298.4 | 288.1 |
| 2018 | 273.7 | 286.2 | 307.9 | 307.4 | 311.3 | 318.7 | 324.8 | 319.2 | 299.5 | 277.4 | 269.7 | 269.5 |
| 2019 | 273.7 | 278.2 | 291.5 | 291.2 | 283.8 | 288.9 | 319.9 | 318.4 | 294.8 | 282.8 | 241.8 | 258.6 |
| 2020 | 237.9 | 240.6 | 220.4 | 163.3 | 218.0 | 259.9 | 304.5 | 296.7 | 260.8 | 233.9 | 214.9 | 220.9 |
| 2021 | 213.4 | 224.6 | 219.3 | 235.4 | 248.2 | 288.2 | 282.9 | 264.3 | 234.1 | 228.8 | 214.0 | 212.6 |
| 2022 | 209.6 | 218.7 | 203.8 | |||||||||
| - = No Data Reported; -- = Not Applicable; NA = Not Available; W = Withheld to avoid disclosure of individual company data. |
| Release Date: 5/19/2022 |
| Next Release Date: TBD |